Biomedical Engineering Reference
In-Depth Information
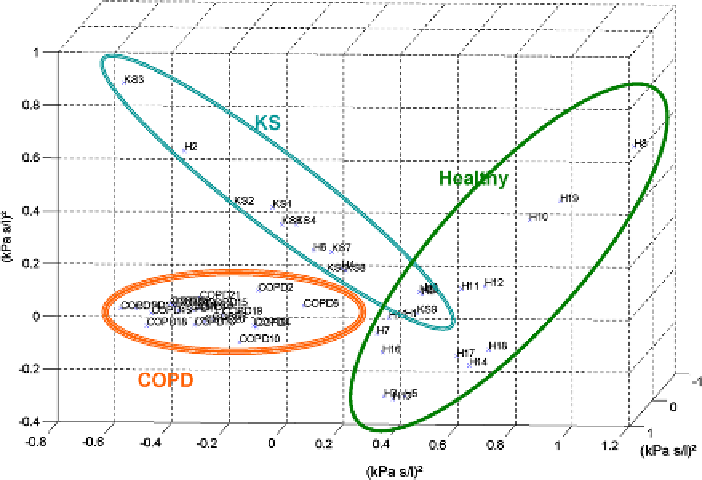
Fig. 8.13
The MDS results for the adults, using (
8.15
), providing good separation between the
groups
children and those with asthma and CF. Similar results are obtained with relation
(
8.16
).
In Fig.
8.13
, one can observe the MDS plot using all three groups of adults
(healthy, COPD, KS) in one matrix. A clear separation between these groups is
obtained using (
8.15
), but not when using (
8.16
). The choice of distance metrics is
therefore important when more than two groups are compared.
Further on, the mapping obtained with the MDS for relations (
8.15
)isgivenin
Fig.
8.14
, respectively for (
8.16
)inFig.
8.15
, for all three children groups (healthy,
asthma, and cystic fibrosis).
Dendrograms are often used for displaying relationships among clusters. A den-
drogram shows the multi-dimensional distances between objects in a tree-like struc-
ture. Objects which are closest to each other in the multi-dimensional data space
are connected by a horizontal line, forming a cluster which can be regarded as a
“new” object. The new cluster and the remaining original data are again searched
for the closest pair, and so on. The distance of the particular pair of objects (or clus-
ters) is reflected in the height of the horizontal line. Therefore, for comparison with
MDS, using the same measure (
8.15
), the corresponding dendrograms for adults and
children are given in Figs.
8.16
and
8.17
, respectively. From all possible variations,
the dendrogram using an unweighted average method provided reasonable cluster-
ing results. It is worth noticing that when applied in paired-sets, the dendrogram
clustering is more homogeneous and can be easily applied to clinical use.