Biomedical Engineering Reference
In-Depth Information
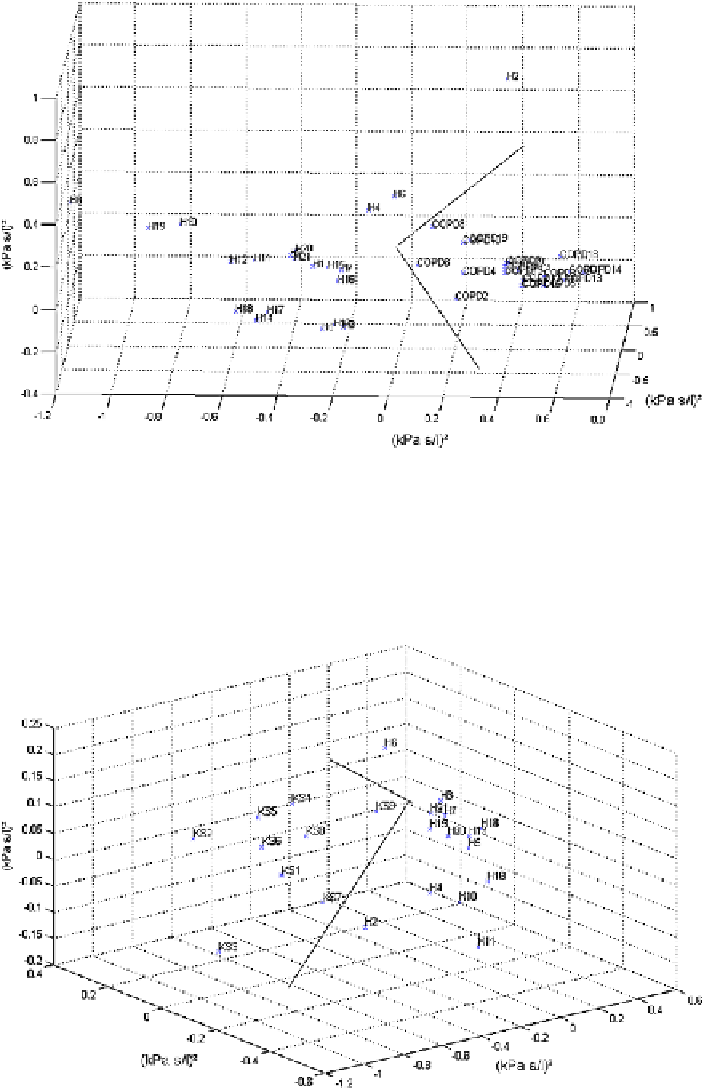
Fig. 8.9
In adults: MDS plot, using expression (
8.15
), for healthy (H) vs. chronic obstructive
pulmonary disease (COPD), providing a perfect separation between the groups
Fig. 8.10
In adults: MDS plot, using expression (
8.15
), for healthy (H) vs. kyphoscoliosis (KS),
providing a perfect separation between the groups