Biomedical Engineering Reference
In-Depth Information
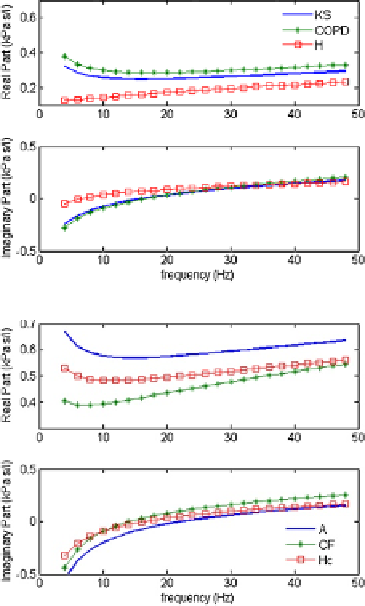
Fig. 8.5
Va l u e s f o r t h e
respiratory impedance in
adults with KS:
kyphoscoliosis, COPD:
chronic obstructive
pulmonary disease and in H:
healthy adults
Fig. 8.6
Va l u e s f o r t h e
respiratory impedance in
children with A: asthma, CF:
cystic fibrosis and in Hc:
healthy children
must have real, positive entries. One can also specify
D
as a full similarity matrix,
with ones along the diagonal and all other elements less than 1. In this application
we use the dissimilarity matrix form for
D
.
8.2.2 Classification Ability with Pathology
Illustrative, averaged values of respiratory impedance in adults with COPD,
kyphoscoliosis, and healthy, are given in Fig.
8.5
, by means of respective real and
imaginary parts obtained with (
3.8
). Similarly, the respiratory impedance values in
children are given in Fig.
8.6
. Notice the differences in real and imaginary parts,
leading to differences in the MDS scaling matrix.
Before proceeding to the MDS plots, first we shall present the analysis for stress
and Shepard plots. The stress plots are always decreasing and they have a
knee
,i.e.a
change in the velocity of decreasing. That knee is usually adopted as an engineering
compromise for deciding the number of dimensions to adopt in the MDS plot. In
the stress plots we have for the adults in Fig.
8.7
-A, for (
8.15
), stress plot “knee”
at
n
i
=
2. This suggests
that (
8.16
) is “less demanding” in what concerns the MDS plot dimension, hence
3 and in Fig.
8.7
-B for (
8.16
), stress plot “knee” at
n
i
=