Biomedical Engineering Reference
In-Depth Information
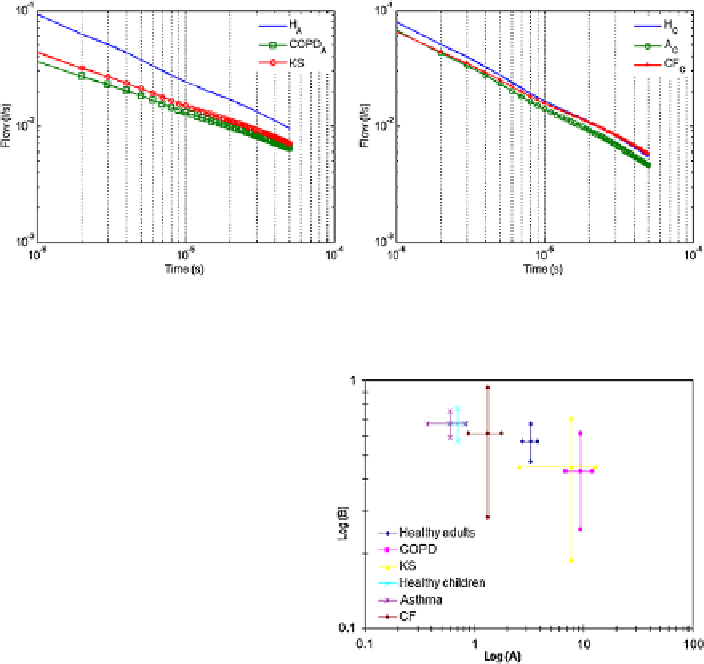
Fig. 8.3
Log-Log plot of the averaged impulse response of the admittance in adults (
left
)andin
children (
right
)
Fig. 8.4
The locus of the
identified
A
and
B
values
from model (
8.9
)
values are given in Table
8.2
. The locus plot of the values from Table
8.2
is depicted
by Fig.
8.4
.
From the results presented in this paper, it is clear that the specificity of the res-
piratory disorders in
COPD
A
and
KS
A
, respectively, has a significant impact on the
fractal dynamics of the respiratory system (
p
0
.
01). However, the
A
C
group were
controlled by means of medication, hence their lung function test was normal to the
exam. This is often the case, since asthma does not manifest itself as a continuous
phenomenon, mostly being triggered by external factors (i.e. allergens). Bearing
these facts in mind, it is no surprising that the fractal dynamics in
H
C
and in
A
C
are
similar (
p<
0
.
2). In
CF
C
, there is no specificity in the manifestation of the disease
with respect to respiratory airways and tissue, but its manifestation is overall the
respiratory airways and tissue (
p
0
.
01).
From a practical point of view, the impulse response describes the dynamics of
the respiratory airways and tissue. The results depicted in Fig.
8.2
show that with
disease, the amplitude is diminished and the decay is accelerated, showing viscous
effect (i.e. fibrosis of the tissue). In other words, in patients suffering from obstruc-
tive (
COPD
A
,
A
C
) or restrictive disease (
KS
A
), a much higher pressure (impulse
amplitude and time interval) must be applied to obtain the same airflow as in healthy.