Biomedical Engineering Reference
In-Depth Information
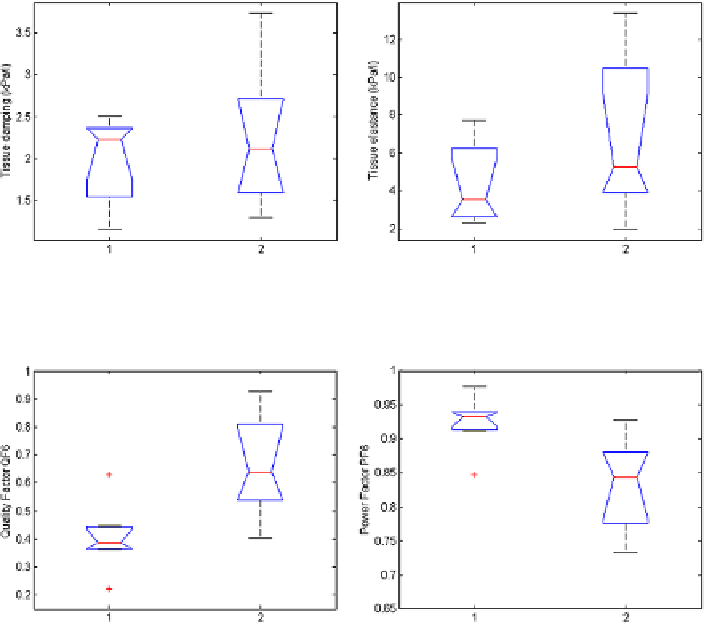
Fig. 7.28
Tissue damping
G
r
(
left
) and tissue elastance
H
r
(
right
)in
1
: healthy and
2
:cystic
fibrosis. See corresponding
p
-values discussed in text
Fig. 7.29
Quality factors
QF
6(
left
) and power factors
PF
6(
right
) evaluated at 6 Hz in
1
: healthy
and
2
: cystic fibrosis. See corresponding
p
-values discussed in text
G
r
(
p<
0
.
46) and tissue elastance
H
r
(
p<
0
.
17), as observed from Fig.
7.28
.The
boxplots for the quality factor
QF
6 and the power factor
PF
6aregiveninFig.
7.29
,
which were significantly different between the groups (
p
0
.
01). Finally, the box-
plot for the real part of impedance at 6 Hz,
R
6(
p
0
.
01), and for tissue hystere-
sivity
η
r
(
p<
0
.
23) are given in Fig.
7.30
.
Lung disease in CF begins in the distal airways and should be therefore reflected
in abnormalities of the intra-parenchymal airways and parenchymal mechanics. By
its intrinsic nature, the identified FO4 model should be able to determine such
changes. However, in order to partition the airway and parenchymal mechanics,
one needs to measure at low frequencies, i.e. a decade lower than 5 Hz. Since in our
study we are not envisaging such frequency range, it is not surprising that no sta-
tistical significant differences in tissue damping, elastance, and hysteresivity were
obtained. In a study over the 0.5-20 Hz frequency range using the model structure
from (
7.2
), there was also no significant difference between the measures of lung
function (airway or parenchymal) in infected or uninfected children with respira-
tory pathogen [
15
]. In [
15
] it was shown that the FO2 model can provide separate