Biomedical Engineering Reference
In-Depth Information
Fig. 7.26
Impedance plots
for the children with cystic
fibrosis
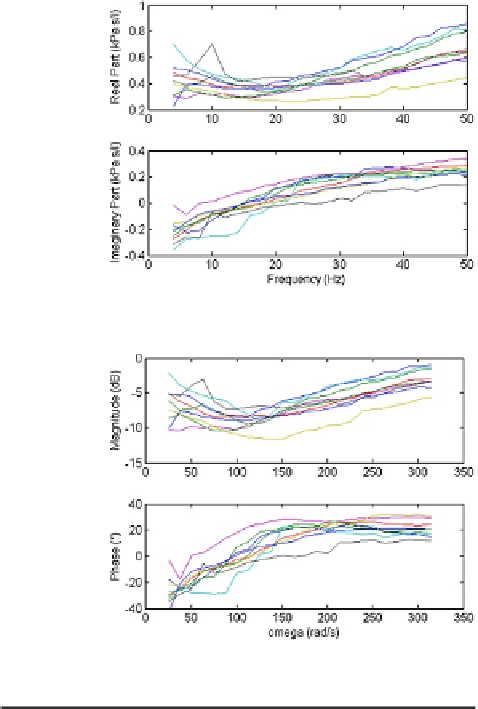
Fig. 7.27
Bode plots for the
children with cystic fibrosis
Ta b l e 7 . 1 4
The identified
model parameters in the two
groups; values are given as
mean
Healthy
Cystic fibrosis
L
r
0
.
11
±
0
.
08 (0.06, 0.15)
0
.
07
±
0
.
03 (0.05, 0.10)
standard deviations;
values in brackets denote the
95 % confidence intervals
±
1
/C
r
4
.
73
±
2
.
73 (3.2, 6.2)
8
.
67
±
4
.
63 (5.11, 12.23)
±
±
α
r
0
.
32
0
.
11 (0.26, 0.38)
0
.
38
0
.
08 (0.31, 0.44)
±
±
β
r
0
.
63
0
.
16 (0.54, 0.72)
0
.
77
0
.
15 (0.66, 0.89)
G
r
1
.
91
±
0
.
68 (1.53, 2.29)
2
.
07
±
0
.
85 (1.41, 2.73)
H
r
4
.
10
±
3
.
01 (2.44, 5.76)
8
.
26
±
4
.
86 (4.52, 12.00)
η
r
0
.
70
±
0
.
38 (0.49, 0.91)
0
.
38
±
0
.
29 (0.15, 0.61)
R
6
0
.
49
±
0
.
06 (0.46, 0.53)
0
.
38
±
0
.
08 (0.32, 0.45)
Frez
21
±
5
.
9 (17.81, 24.18)
15
.
75
±
4
.
71 (11.80, 19.69)
QF
6
.
41
±
0
.
11 (0.35, 0.48)
0
.
67
±
0
.
18 (0.52, 0.81)
PF
6
.
91
±
0
.
03 (0.89, 0.93)
0
.
82
±
0
.
06 (0.77, 0.88)
E
R
0
.
05
±
0
.
01
0
.
07
±
0
.
03
E
X
0
.
04
±
0
.
01
0
.
05
±
0
.
04
E
T
0
.
06
±
0
.
02
0
.
10
±
0
.
05