Biomedical Engineering Reference
In-Depth Information
Ta b l e 7 . 1 3
±
standard deviation; (
bc
) denotes values after bronchial challenge; values in brackets denote the
95 % confidence intervals
Healthy
The identified model parameters in the three groups; values are given as mean
Asthma
Asthma (bc)
L
r
0
.
11
±
0
.
08 (0.06, 0.15)
0
.
13
±
0
.
17 (0.03, 0.23)
0
.
08
±
0
.
04 (0.06, 0.11)
1
/C
r
4
.
73
±
2
.
73 (3.2, 6.2)
7
.
96
±
3
.
16 (6.21, 9.7)
7
.
95
±
3
.
31 (6.13, 9.78)
α
r
0
.
32
±
0
.
11 (0.26, 0.38)
0
.
32
±
0
.
09 (0.27, 0.38)
0
.
34
±
0
.
10 (0.28, 0.40)
β
r
0
.
63
±
0
.
16 (0.54, 0.72)
0
.
70
±
0
.
13 (0.62, 0.77)
0
.
76
±
0
.
15 (0.67, 0.85)
G
r
1
.
91
±
0
.
68 (1.53, 2.29)
3
.
21
±
1
.
75 (2.25, 4.18)
2
.
33
±
0
.
90 (1.84, 2.82)
H
r
4
.
10
±
3
.
01 (2.44, 5.76)
7
.
06
±
3
.
18 (5.3, 8.81)
7
.
47
±
3
.
61 (5.34, 9.39)
η
r
0
.
70
±
0
.
38 (0.49, 0.91)
0
.
53
±
0
.
29 (0.37, 0.70)
0
.
48
±
0
.
66 (0.13, 0.84)
QF
6
.
41
±
0
.
11 (0.35, 0.48)
0
.
60
±
0
.
17 (0.52, 0.69)
0
.
61
±
0
.
16 (0.52, 0.7)
PF
6
0
.
91
±
0
.
03 (0.89, 0.93)
0
.
85
±
0
.
06 (0.82, 0.88)
0
.
85
±
0
.
06 (0.81, 0.88)
R
6
0
.
49
±
0
.
06 (0.46, 0.53)
0
.
61
±
0
.
37 (0.42, 0.8)
0
.
44
±
0
.
24 (0.31, 0.56)
Frez
21
±
5
.
9 (17.81, 24.18)
22
.
94
±
12
.
29 (17.01, 28.87)
16
.
66
±
9
.
4 (11.98, 21.34)
E
R
0
.
05
±
0
.
01
0
.
09
±
0
.
03
0
.
08
±
0
.
02
E
X
0
.
04
±
0
.
01
0
.
06
±
0
.
04
0
.
04
±
0
.
01
E
T
0
.
06
±
0
.
02
0
.
12
±
0
.
05
0
.
09
±
0
.
03
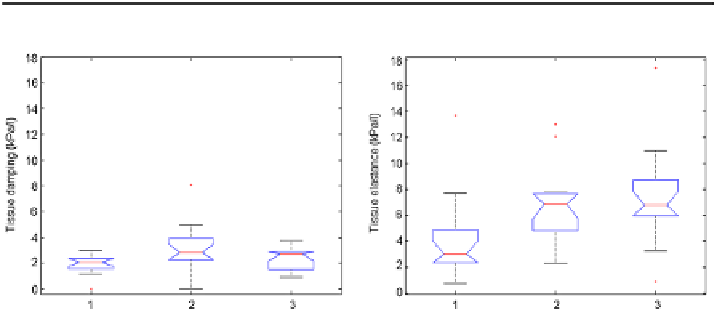
Fig. 7.23
Tissue damping
G
r
(
left
) and tissue elastance
H
r
(
right
)in
1
: healthy;
2
: asthma; and
3
: asthma after bronchial challenge. See corresponding
p
-values discussed in text
pendently. Tissue damping was higher in asthma and became lower after bronchial
challenge. Tissue elastance increased in asthma after bronchial challenge.
Lower
QF
6 values were obtained in the healthy group in Fig.
7.24
(
p
0
.
01),
denoting that higher amount of air circulates in the lungs than in asthma. A slight
decrease in
QF
6 values suggests an improvement in the air flow after bronchial
challenge in asthma groups (decreased overall damping factor). The corresponding
values for the
PF
6 show that in healthy lungs, the overall system is more efficient to
use the available energy than in asthmatic lungs (
p
0
.
01), hence increased work
of breathing in asthma.