Biomedical Engineering Reference
In-Depth Information
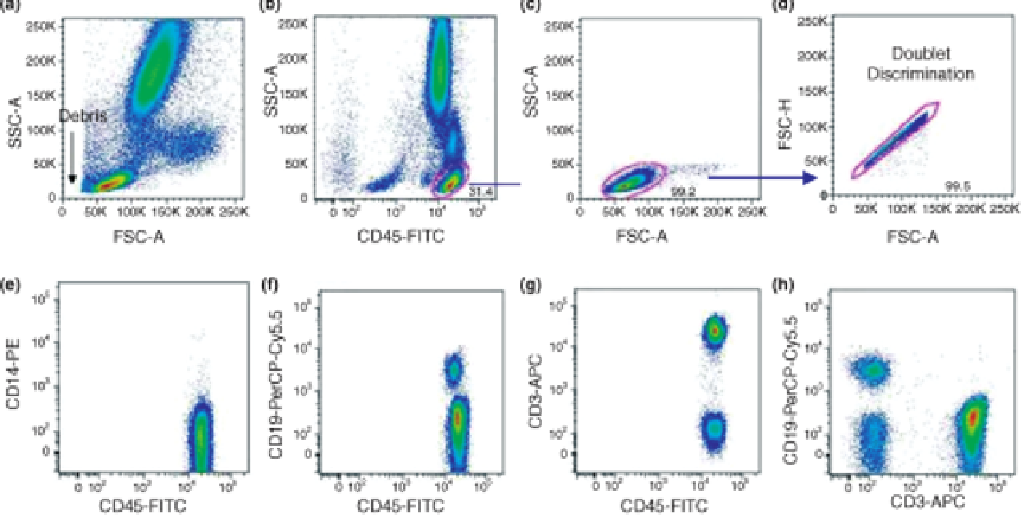
FIGURE 1.7
Typical gating for lymphoid cells. (a) The different populations of cells present in the sample are visualized based on their size (FSC) and
complexity (SSC). Thresholding was performed to remove debris (arrow). (b) The cells are stained with a FITC-labeled antibody that recognizes CD45, a
hematopoietic lineage marker (referred to as CD45-FITC). The circled population indicates lymphoid gate (high FSC but very low SSC). (c) CD45-gated
lymphoid cells are reevaluated to exclude large CD45
þ
cells. (d) Doublets that are distinguished from singlets on the basis of FSC-H/FSC-A ratio are
excluded from the area of interest indicated with the circle. Detection of macrophages (CD45
þ
CD14
þ
) (e), B cells (CD45
þ
CD19
þ
) (f), and T cells
(CD45
þ
CD3
þ
) (g). (h) Two subpopulations, B and T cells, can be easily visualized on the same dot plot.
Search WWH ::

Custom Search