Biomedical Engineering Reference
In-Depth Information
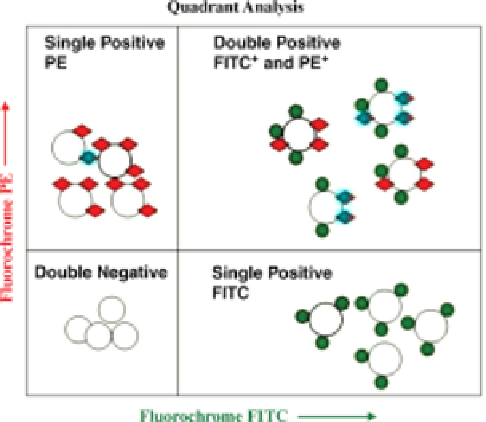
FIGURE 1.6
Idealized two-parameter quadrant analysis. A population of cells is stained for
two markers labeled with PE indicated with a diamond (y-axis) and FITC indicated with a solid
small circle (x-axis). Lower left quadrant: cells lacking both the markers, and hence double
negative. Lower right quadrant: cells FITC and shown as cells with solid circles. Upper left
quadrant: cells PE and shown as cells with diamonds. Upper right quadrant: cells expressing
both markers, also called double positive, and shown as individual cells (diamonds and solid
circles) together.
1.8.1 Flow Histogram
For single-color analysis, the events can then be plotted as a single parameter such as a
histogram, in which the x-axis is the measurement and the y-axis is the number of
events. Usually the x-axis corresponds to channels (typically, 1024 channels); the
brighter the specific fluorescence the higher the channel number. A new “Logicle”
display method (also known as biexponential method) when analyzing flow data
enables the close to zero signals to be shown on the plot graph that combines both the
logarithmic and linear scales, providing a more complete way of interpretation of
data [11, 69, 70]. Multicolor flow analysis is often displayed as two-color analysis. In
Figure 1.6, an idealized phenotype of cells in two-color analysis is shown.
1.8.2 Thresholding and Doublet Discrimination
The flow cytometer parameters can be set such that only events whose intensity is
greater than a particular threshold value are recorded. This is called thresholding and it
can be used to eliminate debris (Figure 1.7a), that is, cells having a very low FSC and
SSC. Cells of interest can be gated based on fluorescence parameters; for example,
expression of CD45 with low side scatter predominantly identifies lymphoid cells
Search WWH ::

Custom Search