Biomedical Engineering Reference
In-Depth Information
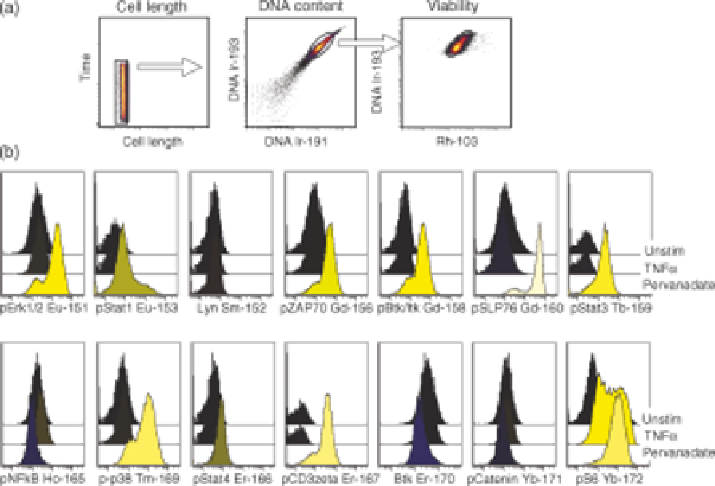
FIGURE 15.11
Mass cytometry experiment analyzing 17 parameters simultaneously,
including 14 intracellular parameters. KG1 cells were left untreated or stimulated with TNF
a
or pervanadate. Fixed and permeabilized cells were stained for the indicated intracellular
antigens and analyzed by mass cytometry on a CyTOF instrument. (a) Cellular events were
identified by gating based on cell event length, DNA content, and viability before fixation. (b)
Histogram overlay representation of the data. Histograms are colored according to the fold
change in phosphorylation or protein level upon induction, relative to the untreated control.
Data analysis was performed in Cytobank software [35].
platform. Even then, information would be lost due to the lack of simultaneous
measurement. The other aspect of increased throughput comes from barcoding
approaches. As mentioned, FCB provides the ability to mix cells from multiple
conditions into a single tube where their individual profiles can be reconstructed
postanalysis, thereby saving analysis time and reagents. In the case of mass cytometry,
it is also possible to label cells with metal isotopes using reactive chelators of
nanoparticle labeling [36]. Even taking a binary approach with 7 metals (present or
absent), one could combine 128 different samples (2
7
) into the same tube leaving 23
parameters available for analysis.
15.7.3.5 Accuracy
Fluorescence flow cytometry can be highly quantitative.
However, as the number of parameters measured simultaneously increases, data
become less reliable due to spectral overlap. On the other hand, ICP-MS
measurements at the heart of mass cytometry were originally developed for the
absolute quantification of elements and stable isotopes in a variety of complex
matrices. Consequently, the signal obtained is directly and quantitatively related to the
Search WWH ::

Custom Search