Biomedical Engineering Reference
In-Depth Information
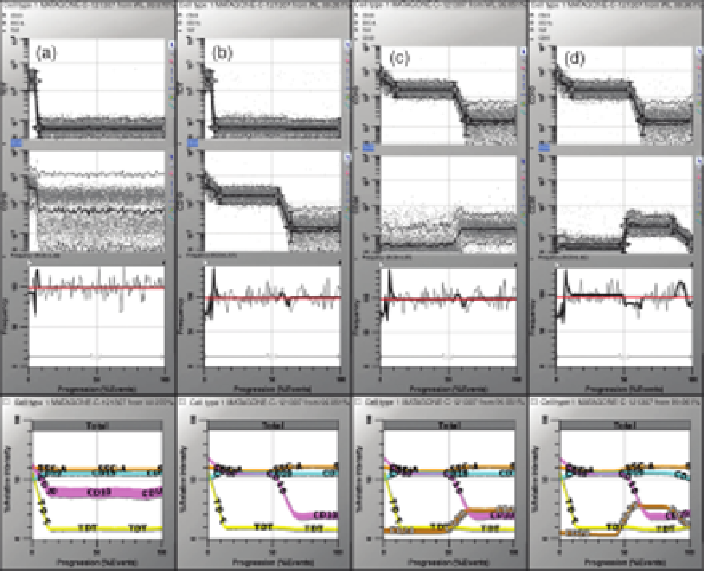
FIGURE14.10
Sequence of analysis steps for finding the normal bonemarrowB-cell lineage
in a 12-parameter listmode file. This figure shows the next four analysis steps (data kindly
provided by Fred Preffer, Harvard University). See text for details. (See the color version of the
figure in the Color Plates section.)
When we choose a three-level parameter profile that follows the progression defined
by the literature and let the programfind the optimal placements of the control definition
points, we find a solution (Figure 14.10b). As soon as CD10 is added to the model, we
can see additional structure appear in both the CD19 and the SSC parameters.
Youmight ask at this point whether we could have startedwithCD10 instead of TdT.
The answer is yes, we could have, but it would not have been as easy as it sounds
because CD10 is more complicated than TdT. The slight decrease in CD10 in the early
B-cell stagewas easier to seewith TdTalready defined. You are always best off starting
with simple parameter profiles andmoving towardmore complex ones. Could we have
started with CD34? As you will soon see, in this data set CD34 did not have quite the
dynamic range that TdT did. Therefore, starting with TdTwas our best choice for this
data set, but we could have started differently and achieved the same solution.
14.7.2 CD20 Step-Up and Step-Down Parameter Profiles
Let us now look at CD20 (Figure 14.10c). The model thus far shows us that CD20 is
upregulated when CD10 is downregulated. We do not need the metainformation to
Search WWH ::

Custom Search