Biomedical Engineering Reference
In-Depth Information
Intensity
Stage I
Stage II
Stage III
Stage IV
Bright
Moderate
Dim
Negative
CD19
CD10
CD34
CD22
CD22
CD20
CD45
SS
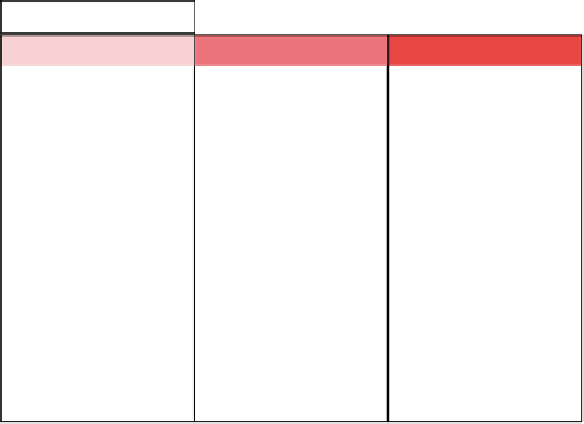
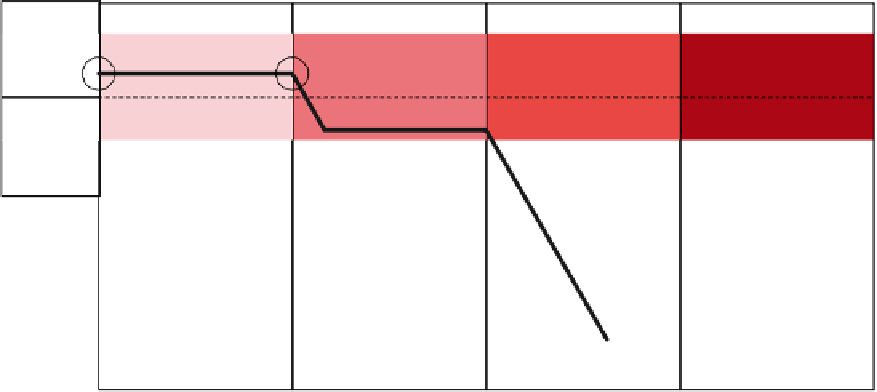
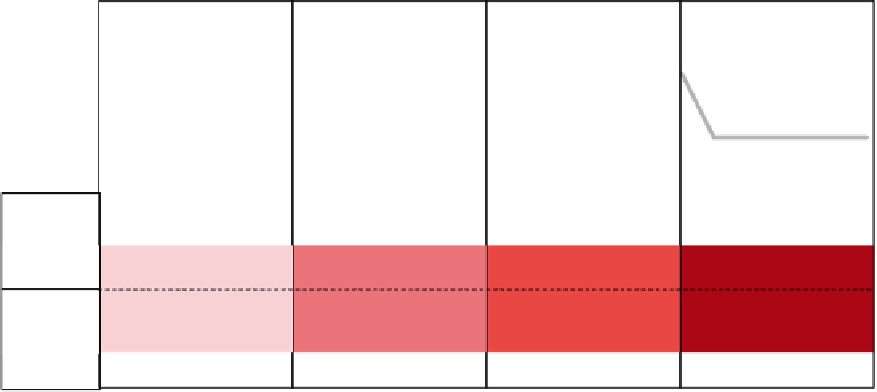
FIGURE 14.2
Chart of changes in marker expression with normal B-cell lineage. This figure shows the changes in CD19 (black), CD10 (blue), CD20
(green), CD34 (cyan), CD22 (green), CD45 (yellow), and SS (SSC) (orange) with normal B-cell development in the marrow. Adapted from Ref. [2],
Figure 3. (See the color version of the figure in the Color Plates section.)


Search WWH ::

Custom Search