Biomedical Engineering Reference
In-Depth Information
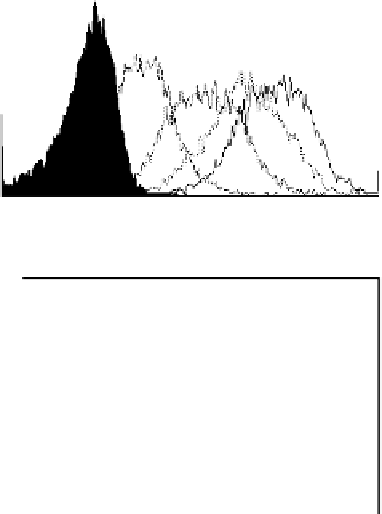
Drug responsiveness of a cell line is assessed initially in assay optimization and the
drug concentration selected based on the signal and the need to detect neutralizing
activity. An example of a drug-fluorochrome conjugate binding to cell surface
receptor is shown in Figure 10.5a and b, together with a titration of the positive
(a)
10
0
10
1
10
2
10
3
10
4
FL4-H
(b)
4000
3000
2000
1000
0
0.01
0.1
1
10
100
Concentration
(c)
700
GMFI
600
500
400
300
200
100
0
0.1
1
10
100
Concentration
FIGURE 10.5
Labeled biotherapeutic binding to a relevant cell line. Labeled drug dose-
response curve shown as overlayed histograms (a) or plotted as a dose curve (b). Titration of the
positive control with a fixed amount of drug-fluorochrome (c).


Search WWH ::

Custom Search