Biomedical Engineering Reference
In-Depth Information
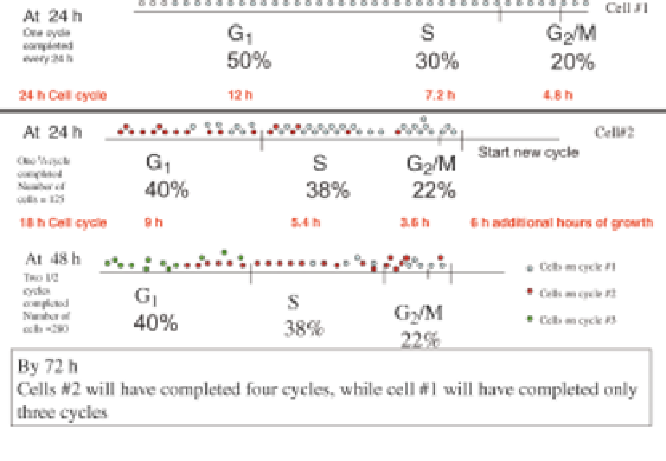
FIGURE 5.6
Examples of a comparative distribution of cells at the different phases of the cell
cycle during a series of doubling times covering a 72 h testing period on two cell lines with
different doubling times. (See the color version of the figure in the Color Plates section.)
cycle and the length of time they stay in that specific phase of the cycle. This means
that when a cell population shows 60% of cells in the G
0
/G
1
phase of the cycle, they
also stay 60% of their cycling time at that phase of the cycle.
This link between cycling times and frequency distributions creates another
variability that goes beyond the shape of the profile itself and identifies cells that
even though are present in one phase of the cycle, in reality are further along in the
number of their duplication cycles.
Figure 5.6 is provided to help illustrate this point and shows that on a scheduled
experimental sampling sequence, where samples are taken at 24, 48, and 72 h for two
cell lines with different doubling times, the cells in the upper row of the figure will
have passed through one, two, or three doubling cycles, respectively, for the different
samplings. Thus, by 72 h, the cells illustrated in the lower row will have completed
four cycles of growth, while the cells in the upper rowwill had gone only three cycles.
This is because the more rapidly dividing cell population will have moved further
along the different traverse phases of each cycle since their doubling time is only 18 h.
The only way to identify these kinds of movements of a cell population is to add
another parameter to thesemeasurements, such as bromodeoxyuridine (BrdU) or EdU
that are specifically incorporated into DNA during its duplication time (see below).
5.2.3.3 Adding Other Parameters to Identify Movements of Cells Along the
Different Phases of Their Cell Cycle Profiles There are several different
approaches that can be taken using other biomarkers to evaluate cell cycle
Search WWH ::

Custom Search