Biomedical Engineering Reference
In-Depth Information
on the cutoff criteria.
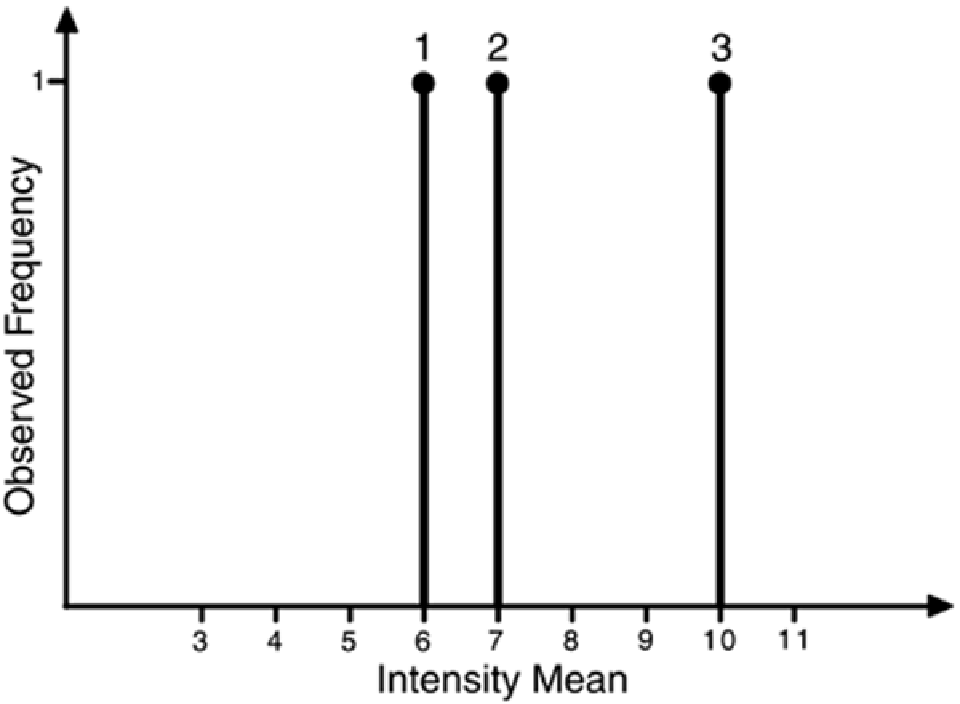
Figure 6-18. Observed Frequency of Differences Between Means. The
intensity values associated with sample 3 appears to be different from the
values derived from samples 1 and 2. The scale of intensity mean values is
arbitrary.
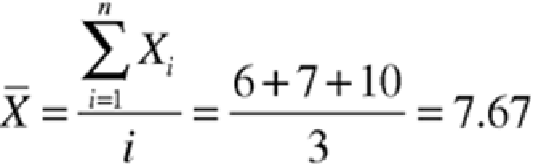
Mathematically, the mean intensity value is computed as:
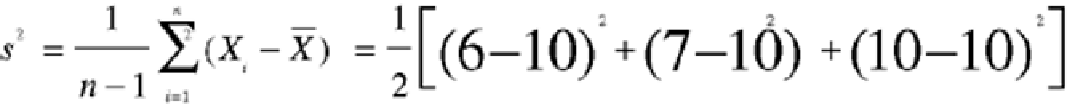
The standard deviation (
s
), a measure of variability in the sampled data, is computed as: