Biomedical Engineering Reference
In-Depth Information
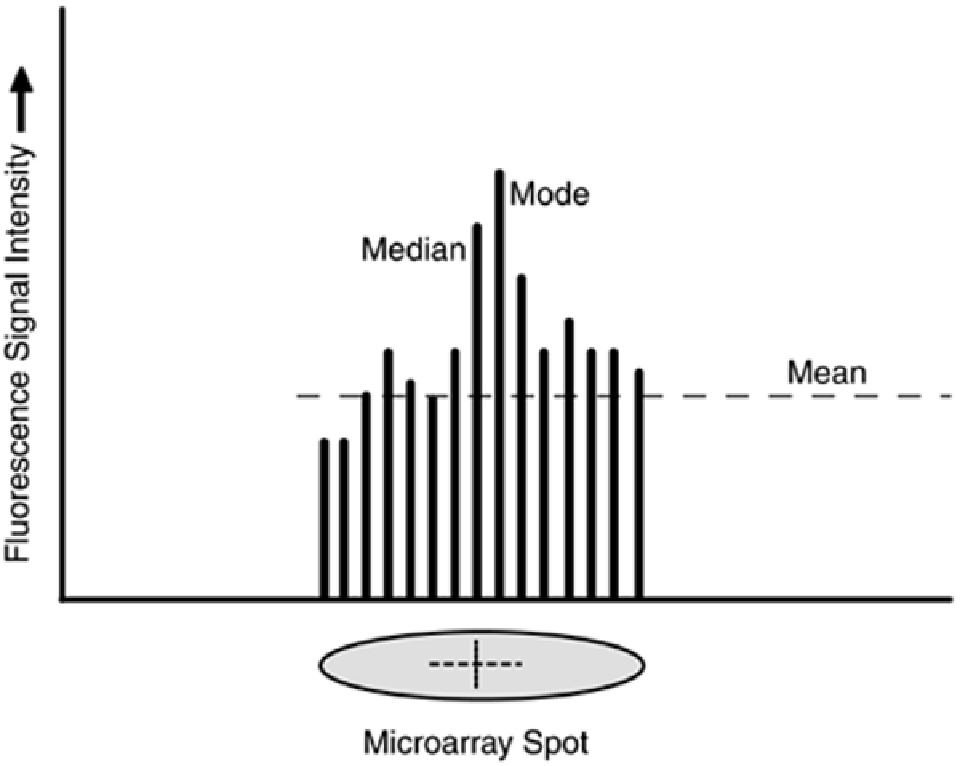
outlier values, but the measure is unstable when the intensity plot is bimodal (has two major peaks).
The median, the mid-point in the intensity plot, is also resistant to outliers.
Figure 6-15. Microarray Fluorescence Statistical Analysis.
Other measures of assessing spot intensity include the total pixel intensity—the sum of all pixels
corresponding to fluorescence in an area. However, the total intensity value is sensitive to the
amount of DNA deposited on a spot in the microarray. The volume measure is the sum of signal
intensity above background noise for each pixel. Although there are several additional means of
quantifying spot fluorescence, the most common measure is the mean, followed by the mode and
median descriptive statistics.
Possible fluorescence intensity distributions associated with common spotting errors are illustrated in
Figure 6-16
. Notice that each distribution results in a different mean and median intensity reading,
even though the gene expression in each case is identical. The role of statistical analysis in reading
the intensity value associated with each spot is to control for variability—a challenge that isn't always
possible. For example, when a microarray is contaminated, simple statistical analysis on individual
spots offers little in the way of reducing variability or noise. However, inter- and intra-microarray
comparisons can be used to identify contamination and other sources of variability.
Figure 6-16. Microarray Spot Intensity Distributions.