Biomedical Engineering Reference
In-Depth Information
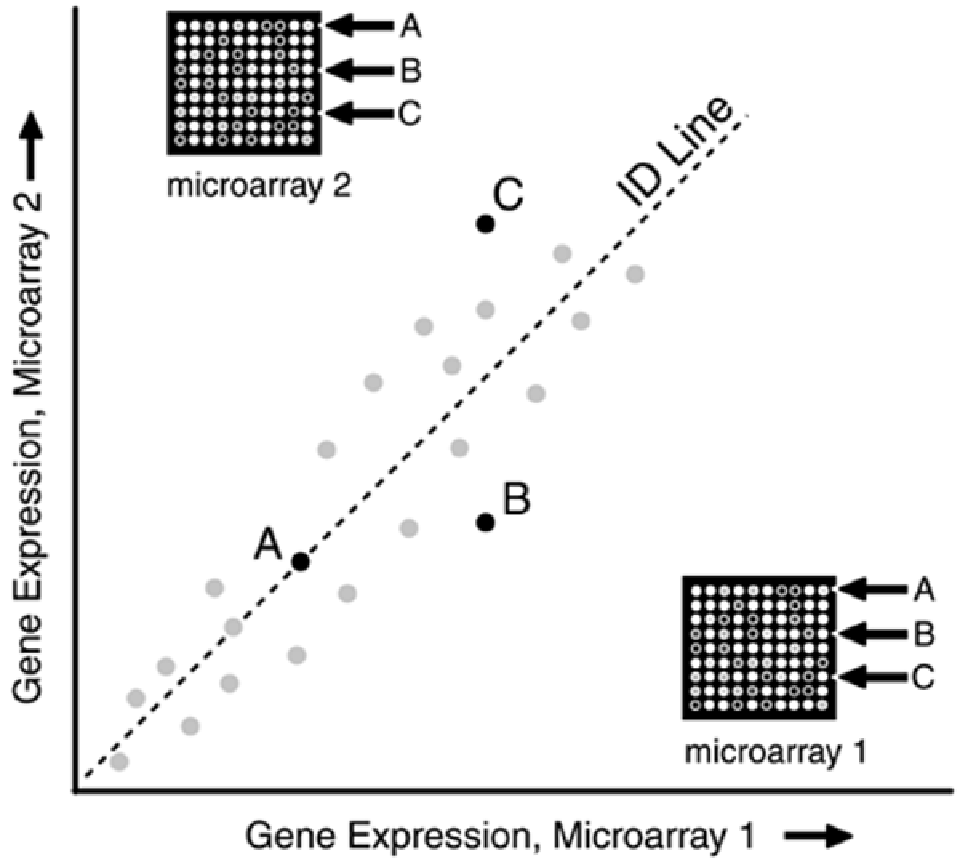
The common reasons for variability in spotting, as reflected by deviation from the ID line, are listed
in
Table 6-2
. Reasons for variability in spotting results include variability in the microarray surface
chemistry, inaccuracies in the various instruments used to prepare the reagents and monitor the
environment, and fluctuations in the temperature, humidity, and other hybridization conditions.
Variations in the degree of DNA attachment to the slide, in the volume of cDNA applied during the
spotting process, and in the location of spots on the microarray slide are often caused by the robot
and other mechanical equipment.
Assuming a microarray passes scatter plot analysis, the microarray data are typically arranged in the
form of an expression matrix. Whereas data on the microarray don't necessarily follow a particular
pattern, the standard expression matrix is arranged by gene and experimental condition, as
illustrated in
Figure 6-5
. Conditions may indicate elapsed time since some event, such as the
activation of another gene, or local environmental changes, such as an increase in temperature, or
the start of drug therapy. Although four experimental conditions are shown for each gene in this
illustration, there is no inherent limitation in the relative number of conditions or genes that can be
represented in the expression matrix, within the total capacity of the microarray. For example, there
may be seven experimental conditions applied to one gene and three to another.
Figure 6-5. Mapping Microarray Data to an Expression Matrix. Note the lack
of correlation between physical experimental position on the microarray
and the mapping of data in the expression matrix. Although shown here in
grayscale, the individual squares in the gene expression matrix are
normally represented by the fluorescence color of the corresponding
microarray spot.