Biomedical Engineering Reference
In-Depth Information
Animation Versus Simulation
Visualization tools can be grouped into three major categories: simulation, animation, and static
graphics. Simulation involves the dynamic, computationally intensive interaction of the user with a
program that reevaluates the underlying data and renders the results. Animation, in contrast,
involves the display of pre-computed data that can be accessed and analyzed as needed to illustrate
certain findings or relationships. The data in the PDB, for example, serves as the data for a rendering
program such as SWISS-PDBViewer that can be used to create animations of rendered molecules
from various perspectives. Rotating a protein structure, as in
Figure 5-21
, doesn't result in a change
in the underlying data. Static graphics, like animations, use fixed data. As in animations, viewing an
image from different perspectives doesn't modify the underlying data.
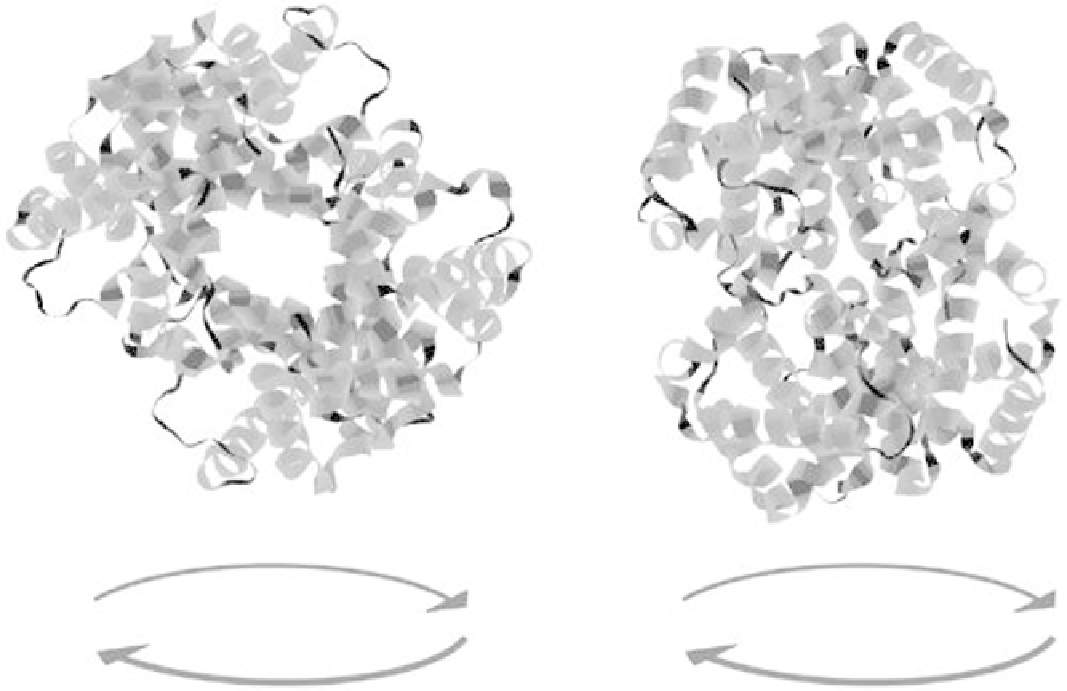
Figure 5-21. Animated Rendering of Deoxy Human Hemoglobin Created by
SWISS-PDBViewer. Rotating structures doesn't result in a recomputation of
the underlying data, but only affects the visualization of the data previously
computed. This figure illustrates two separate frames captured from the
spinning animation.
Some of the rendering packages provide limited simulation capabilities. For example, SWISS-
PDBViewer allows the user to create point mutations along a molecule and then visualize the results.
This is a limited form of simulation, in that a more powerful system can compute the 3D interaction
of multiple proteins as well as alter underlying sequences.