Biomedical Engineering Reference
In-Depth Information
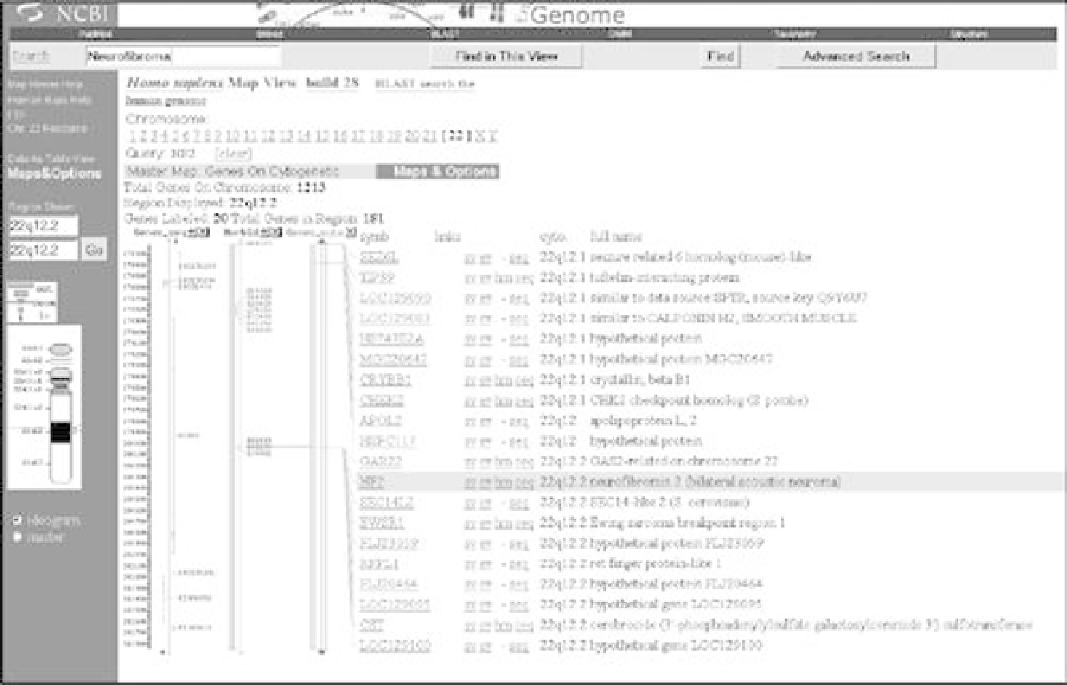
The Web-based Map Viewer program, which is part of NCBI's Entrez integrated system, provides a
composite interface to several of NCBI's online databases. Map Viewer enables users to identify a
particular gene location with an organism's genome, the distance between genes, and the sequence
data for a gene in a particular chromosomal region. Map Viewer illustrates how the main
computational challenge in visualizing linear nucleotide sequences lies in integrating data from
multiple databases. Map Viewer runs inside a Web-browser; all of the graphics processing and
database integration is handled by NCBI.
Unlike working with three-dimensional protein structures, there is relatively little computational
overhead involved in visualizing one-dimensional sequences. Sequences culled from NCBI's
sequential databases are mapped onto the appropriate graphic and relevant links are provided to the
corresponding databases that define the gene sequence and that are related to specific diseases.
Map Viewer provides a graphic depiction of nucleotide sequences through a composite of genetic,
cytogenetic, physical, and radiation hybrid maps, each of which have their particular uses. Genetic
maps show the relative position and order of genes and other sequences on a chromosome, and
serve as high-level approximations of relative distances between sequences. Cytogenic maps provide
a gross indication of the position of exons and entrons along a chromosome, based on optical
microscope techniques. Physical maps show the actual physical location of sequences on a
chromosome. Radiation hybrid maps link genetic and physical maps.
These different representations of a sequence along a chromosome have a variety of applications. For
example, a cytogenic map is probably most appropriate for a researcher interested in quickly
estimating the relative amount of DNA on a chromosome that is involved in coding. A physical map
would be too detailed and difficult to work through, compared to a simple visual inspection of the
relative percentage of exons to entrons across several chromosomes. Conversely, a researcher
interested in the probability that the genes will separate during meiosis would be more interested in a
genetic map, which shows distances between genes and markers (variations at a single genetic locus
due to mutation or other alteration), measured in terms of recombination frequency. The
recombination frequency figure reflects the tendency of genes located close together to be inherited
together, while those that are far apart are more likely to be separated during meiosis. Markers
include single nucleotide polymorphisms (SNPs), which are individual point mutations or substitutions
of a single nucleotide anywhere in the genome.