Graphics Reference
In-Depth Information
a
b
c
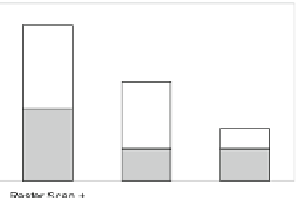
Fig. 10.18
Comparison of DDR3 bandwidth and power consumption across three scenarios. RS
mapping maps all the MAUs in a raster scan order. ACT corresponds to the power and band-
width induced by DRAM Precharge/Activate operations. (
a
) Bandwidth comparison. (
b
)Power
comparison. (
c
) BW across sequences
Table 10.11
Breakdown of
logic area for motion
compensation cache
Logic area
(kgate)
Module
Address Translation
1.1
Hit/Miss Resolution
3.9
Queue
20.5
Tag Register File
64.9
To t a l
90.4
10.7
Intra Prediction
Intra prediction predicts a block of pixels based on neighboring pixels in the same
picture. The neighboring pixels are extrapolated into the block to be predicted
along one of 33 directions or using two other intra modes—DC and Planar. The
neighboring pixels are taken from one row of pixels to the top and one column to
the left.