Graphics Reference
In-Depth Information
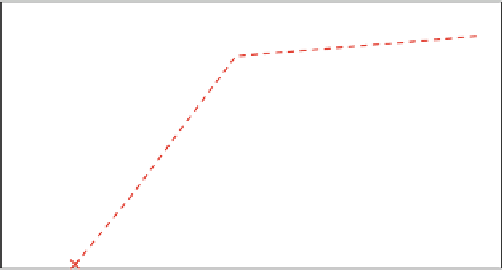
Traffic
5
4.5
4
3.5
3
2.5
2
1.5
AVC
HEVC
1
0
2
4
6
8
10
12
14
Bit rate [Mbit/s]
Fig. 9.15
R-D curve (Traffic)
Tabl e 9. 10
Bit rate differences of tested bitstreams
Confidence
index (%)
Sequence
R(%)
[R
min
, R
max
]
Book
62
[75 %, 51 %]
100
BT709Birthday
71
[81 %, 60 %]
100
HomelessSleeping
87
[94 %, 71 %]
100
Manege
43
[
60 %,
17 %]
88
Traffic
55
[68 %, 39 %]
100
Average
64
[
76 %,
48 %]
98
9.5
Production-Quality Encoder Performance Analysis
This section presents the results of an informal subjective quality comparison
between the eBrisk-UHD and x264 [
23
] production-quality encoders, which were
configured to be conformant with HEVC Main Profile and AVC High Profile,
respectively. The encoder comparison presented in this section is intended to
complement the subjective quality comparisons discussed earlier in this chapter in
which HEVC and AVC encoder reference software were used.
9.5.1
Test Conditions
In this section, the test conditions, including the encoder configuration and evalu-
ation conditions (e.g., sequence presentation details, viewing equipment, lighting
conditions), and tested video sequences are described.