Graphics Reference
In-Depth Information
Book
5
4.5
4
3.5
3
2.5
2
1.5
AVC
HEVC
1
0
2
4
6
8
10
12
Bit rate [Mbit/s]
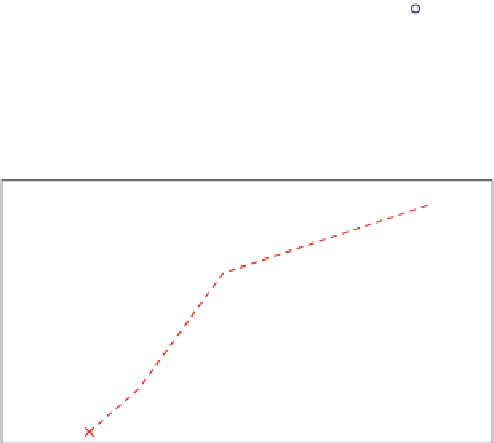
Fig. 9.11
R-D curve (Book)
BT709Birthday
5
4.5
4
3.5
3
2.5
2
1.5
AVC
HEVC
1
0
2
4
6
8
10
12
14
16
Bit rate [Mbit/s]
Fig. 9.12
R-D curve (BT709Birthday)
9.4.2.7
Rate Distortion Curves Results
The R-D curves obtained by the subjective quality evaluation are shown in
Figs.
9.11
,
9.12
,
9.13
,
9.14
and
9.15
.
From these figures, it can be seen that HEVC shows substantial visual quality
improvements over AVC, especially at lower bit rates.
9.4.2.8
Average Bit Rate Difference
The average bit rate difference for HEVC over AVC was computed using the
model proposed in [
7
]. This model is an extension of the Bjøntegaard model [
1
]