Graphics Reference
In-Depth Information
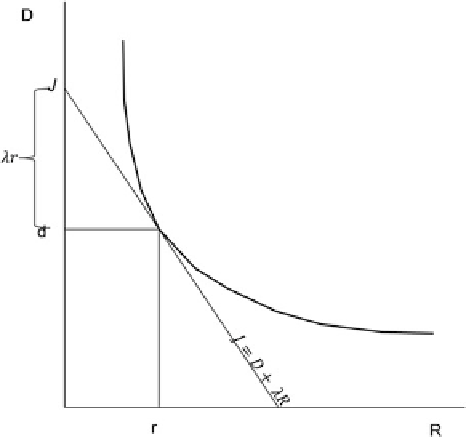
Fig. 9.5
Typical R-D curve
and cost function J with
slope
œ
In AVC and HEVC, the quantization step size
Q
is controlled by a quantization
parameter (
QP
) such that
Q
is proportional to 2
(
QP
-12)/6
and the constant of
proportionality, c, depends on coding mode decisions.
An example based on a graphical minimization of (
9.2
) is shown in Fig.
9.5
,
where a line denoting Lagrangian cost function is plotted against a typical rate-
distortion curve that is a non-increasing convex function of R [
4
]. Minimum
J
can
be achieved by finding the point on the rate-distortion curve which is “hit” first by
the plane wave of slope
œ [
20
].
There are many alternative methods to performing R-D cost optimization. One,
for example, can minimize a frame level distortion or minimize an average frame
distortion, taken over many video frames. These aforementioned methods are not
computationally practical as they will incur significant amount of complexity and
delay. Instead, and as described in [
15
,
19
], minimization of (
9.2
) is performed
for each block of samples (e.g., CUs) independently and in four stages: (1) mode
decision; (2) intra prediction mode estimation; (3) motion estimation; and (4)
quantization. Accordingly, for each block an exhaustive pre-calculation of cost
function, associated with each combination of coding parameters, is performed:
the optimal R-D solution for the block is the combination that minimizes the R-
D cost function. Making block independent assumption despite spatial/temporal
dependencies that could exist between blocks (e.g., current block predictor is
based on the past reconstructed block samples) is generally ignored for practical
applicability [
19
]. We now describe briefly the four R-D optimization stages:
We l e t
S
A
(
i
,
j
)and
S
B
(
i
,
j
) denote the (
i
,
j
)
th
sample in blocks A and B, of the
same size, respectively. For measuring distortion, we use the following metrics as
specifiedin[
15
]: