Hardware Reference
In-Depth Information
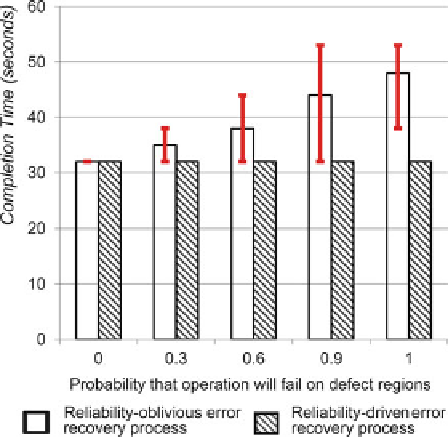
Fig. 2.18
Comparison for the completion time between reliability-driven and reliability-oblivious
error-recovery [
17
]whena1
4 sub-array is defective in the sample preparation of plasmid DNA.
The
error bars
show the maximum and minimum completion time for reliability-oblivious error-
recovery in simulation
Fig. 2.19
Comparison between the completion time of reliability-driven and reliability-oblivious
error-recovery when a 2
4 sub-array is defective in the sample preparation of plasmid DNA.
The
error bars
show the maximum and minimum completion time for reliability-oblivious error-
recovery in simulation
Next we randomly select another operation as
opt
fe
and run the simulation
again. The electrodes that implement
opt
fe
now constitute of a 4
2 electrode
array. The simulation results are shown in Fig.
2.19
. We find that as expected,