Hardware Reference
In-Depth Information
a
Correlation
I(x,y)
O(x,y)
x,y
x,y
Image cut from
input image
Input Image
Correlation Map
Template Image
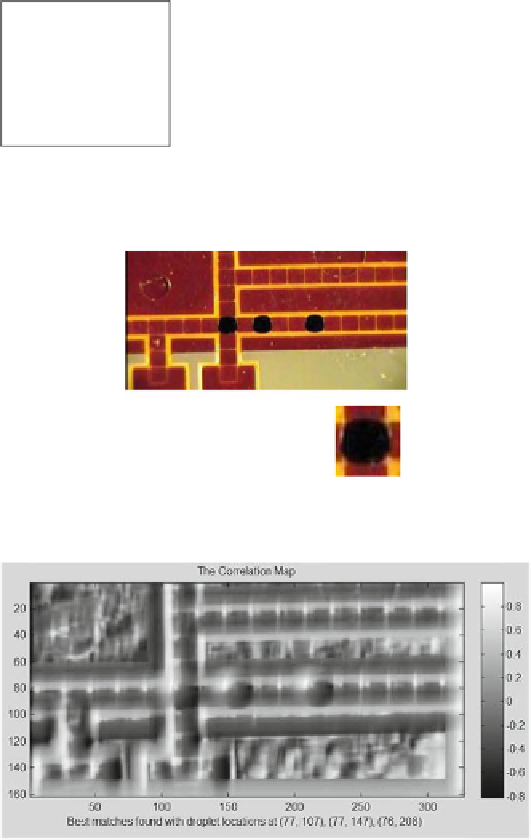
b
The image of a typical droplet
is chose as the pattern
c
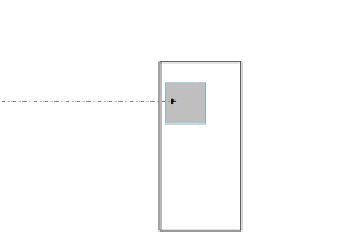
Fig. 2.3
(
a
) The matching process moves the template image to all possible positions in a larger
source image and computes a numerical index that indicates how well the template matches the
sub-image in that position; (
b
) the image of the whole biochip [
18
] and the pattern we selected;
(
c
) the correlation map between image of the whole array and the pattern. The positions of droplets
can be determined by finding maximum elements ( is the number of droplets on the chip) in the
correlation map
First, some calibrations are made before the experiment. We choose a large
number of sub-images with (or without) droplets, and calculate their correlation with