Hardware Reference
In-Depth Information
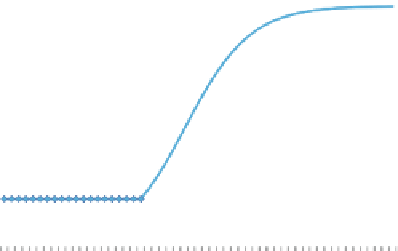
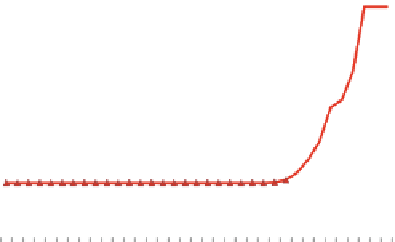
Fig. 5.12
Relationships
between i (i.e., the number of
thermal cycles that have been
carried out) and P.G
c
a
1
P(G
c
|
A
i
)
when
P(G)
= 0.8 and
p
i
= 0.3
0.9
A
i
/
(i.e., the probability that “this
droplet is an empty droplet”)
derived by three statistical
models of PCR procedure
j
0.8
0.7
P(G
c
|
A
i
)
when
P(G)
= 0.7 and
p
i
= 0.2
0.6
P(G
c
|
A
i
)
when
P(G)
= 0.8 and
p
i
= 0.2
0.5
0.4
0.3
0.2
0.1
0
1 4 7 10131619222528313437404346495255
Number of thermal cycles in which no signal is observed
b
1
0.9
P(G
c
|
A
i
)
when
p*
= 10
−
6
P(G
c
|
A
i
)
when
p*
= 10
−
5
0.8
0.7
0.6
P(G
c
|
A
i
)
when
p*
= 10
−
4
0.5
0.4
0.3
0.2
0.1
0
1
6
11
16
21
26
31
36
41
46
51
56
Number of thermal cycles in which no signal is observed
c
1
0.9
0.8
P(G
c
|
A
i
)
when
p'
=10
−
6
0.7
P(G
c
|
A
i
)
when
p'
= 10
−
5
0.6
0.5
P(G
c
|
A
i
)
when
p'
= 10
−
4
0.4
0.3
0.2
0.1
0
1 4 7 0 3 6 9 2 5 8 1 4
Number of thermal cycles in which no signal is observed