Graphics Programs Reference
In-Depth Information
The RGB Curves node
The
RGB Curves
node provides a Bezier-curve-based control for image grading.
This curve represents an input (x axis) versus output (y axis) plot. Modifying this
curve remaps the output range, thereby providing a grading effect. This node also
provides controls to set up black and white levels for the input image.
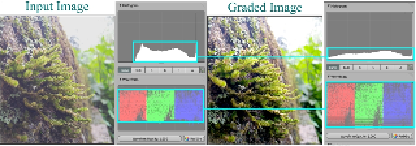
A flat image that has all pixel values in the midtones range can be graded to re-
distribute the pixel values to occupy the complete range of shadows, midtones, and
highlights. This makes the image more vibrant and interesting. An example of this
grading is shown in the following screenshot. The waveforms and histograms of both
the images show the redistribution of pixel values to occupy the complete range and
provide a better graded image.
Grading with this node can be done using Bezier curve or by tweaking the black and
white levels. An appropriate technique can be adapted based on the task.
Grading by setting the black and white levels
The variation between the black and white levels of an image signifies its contrast.
Using the RGB Curves node to increase an image's contrast, instead of using a
Bright/Contrast node, gives the advantage of picking samples from the input image,
The darkest and the brightest levels of the input image can be picked as black and
white levels respectively, as shown in following screenshot. You can pick a sample
using the selector that pops up below the color wheel when either
Black Level
or
White Level
is clicked on.