Java Reference
In-Depth Information
Detect whether a path exists between two given vertices of a graph
●
Find the path with the fewest edges that joins one vertex to another
●
Find the path with the lowest cost that joins one vertex to another in a weighted graph
●
Describe the operations for the ADT graph
●
T
he news media often use line graphs, pie charts, and bar graphs to help us visualize certain
statistics. But these common graphs are
not
examples of the kind of graph that we will study in this
chapter. The graphs that computer scientists and mathematicians use include the trees that you saw
in Chapter 23. In fact, a tree is a special kind of graph. These graphs represent the relationships
among data elements. This chapter will present the terminology we use when discussing graphs, the
operations on them, and some typical applications.
Although the graphs you have drawn in the past likely are not the kind of graph we will discuss
here, the examples in this section will be familiar. But you probably have never called them graphs!
28.1
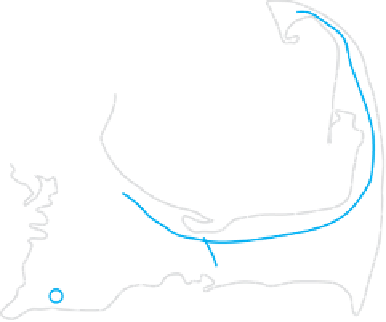
Figure 28-1 contains a portion of a road map for Cape Cod, Massachusetts. Small circles represent
the towns, and the lines that join them represent the roads. A road map is a graph. In a graph, the
circles are called
vertices
, or
nodes
, and the lines are called
edges
. A
graph
, then, is a collection of
distinct vertices and distinct edges. A
subgraph
is a portion of a graph that is itself a graph, just as
the road map in Figure 28-1 actually is a part of a larger map.
FIGURE 28-1
A portion of a road map
Provincetown
Truro
Orleans
Sandwich
Barnstable
Chatham
Falmouth
Hyannis