Game Development Reference
In-Depth Information
Fig. 11.4
Illustration of the local spatiotemporal structure features (Wang et al.
2012
)
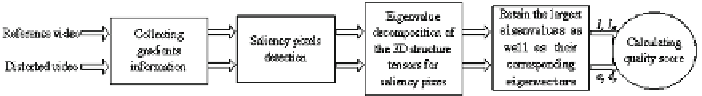
Fig. 11.5
Block diagram of the proposed algorithm (Wang et al.
2012
)
decomposition on both. In particular, for the 3D video data, the 3D structure tensor
at point
p
is given by,
T
S
(
p
)
=∇
I
(
p
)
·∇
I
(
p
)
W
W
)
W
⊡
⊤
I
x
2
(
p
)
I
x
(
p
)
·
I
y
(
p
I
x
(
p
)
·
I
t
(
p
)
⊣
W
W
W
⊦
,
I
y
2
I
x
(
p
)
·
I
y
(
p
)
(
p
)
I
y
(
p
)
·
I
t
(
p
)
=
(11.37)
W
)
W
W
I
t
2
I
x
(
p
)
·
I
t
(
p
I
y
(
p
)
·
I
t
(
p
)
(
p
)
where
denotes partial derivatives along
x
,
y
and
t
directions,
respectively and
W
is a local integration window.
The largest eigenvalues and their corresponding eigenvectors are retained as the
descriptors which are further used to calculate the quality score at this pixel as
follows:
∇=
(∂
x
, ∂
y
, ∂
t
)
2
·
l
r
·
l
d
m
=
l
d
2
×
cos
e
r
,
e
d
,
(11.38)
l
r
2
+
where
l
r
and
l
d
denote the largest eigenvalues of the structure tensors in the reference
video and distorted video, while
e
r
and
e
d
denote their corresponding eigenvectors.
The first term measures the similarity between the variances along their primary
directions in the localized space-time region, and the second term measures the
divergence of their primary directions. Both terms as well as their product lie in
the range of [0, 1]. This score indicates the degree of structural similarity between
the corresponding localized space-time regions at the same position, where a higher
value indicates a better quality. Finally, all of the salient pixel scores are averaged to
give a final video quality index.