Information Technology Reference
In-Depth Information
Comparing the results obtained from the theoretical models we found that
some of the statistics are identical, however, there are notable differences in a
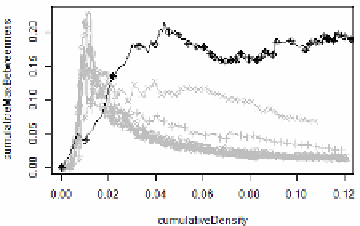
few cases illustrated in Figure 5. The exceptionally high clustering values, the
very low average but extremely high maximal betweenness suggests the existence
of a highly connected core in the network. Other properties like average degree
is linearly increasing in an identical way for all the models and for the dataset.
Fig. 5.
Comparison of simulation results and the empirical data from the monthly
Gulf dataset. The charts show the evolution of different statistics of the cumulative
network (average and maximum betweenness, average path length, clustering, number
of components and proportional size of the largest component) as a function of density.
The empirical dataset is highlighted, the specific elementary dynamic network values
canbereadfromFigure2.