Information Technology Reference
In-Depth Information
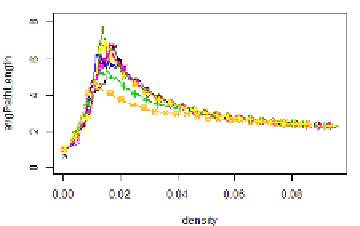
Fig. 2.
Evolution of structural properties of the cumulative networks. The charts con-
tain data obtained from 500 time step simulations where
N
= 100
,G
0
=0
.Otherpa-
rameters configured to add and remove one edge in each time step (
pA
=0
.
2
e
−
3
,pD
=
1
,kA
=1
,kD
=1
). Each plot represents the average of three simulation runs for each
of three random seeds defined for all the models (27 runs in total).
It demonstrates the evolution of structural properties of the cumulative networks
for all the different models over time as a function of density. Three universality
classes may be identified: most of the models show similar behaviour, except the
ones with preferential attachment (namely the CPA and DoubleCPA models)
which dampen the density dependence of the measured values.
2.3 Evolution of Degree Distributions
The previously mentioned difference between the found universality classes is
also reflected in the evolution of the degree distributions of the models. It is sen-
sitive to the length of the aggregation window as well and inherently different for
the snapshot and cumulative networks. Considering that the snapshot networks
are very sparse
2
, we omit their degree distributions because of space limitation.
However, the degree distribution of the cumulative networks are interesting from
several aspects. The same dynamic network may produce a normal, lognormal
or even power law distribution for different aggregation lenghts. We also found
2
Which may be similar to the snapshots of real-world networks in a given instant of
time, based on the used time frame.