Information Technology Reference
In-Depth Information
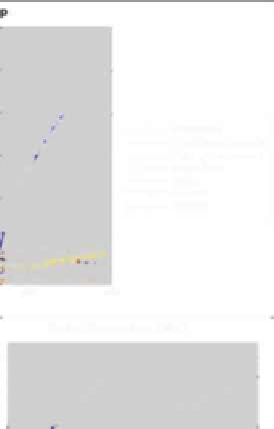
extend. 1997 the irrigation of vineyards becomes legal, which has a great influence on
model results. Within 12 years the area of irrigated vineyards increases to 50.000 ha,
while irrigation of most other crops stays comparatively low. However, this finding is
detached from reality. Though empirical data show an increase of irrigated vineyards
in the mid-1990's, this is observable already before its irrigation becomes legal. After
1995 the area of irrigated vineyards remains relatively constant between 40.000 and
50.000 ha.
Another feature plays a prominent role when looking at empirical data: around
2003 irrigation of traditional cereals increased massively up to 60.000 ha. This model
is not able to capture this feature. All simulations with any parameter combination
show only moderate irrigation of traditional cereals after 1995.
Fig. 4.
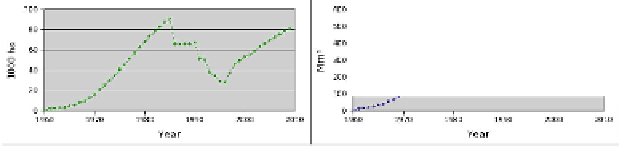
“Best fit” results of the satisficing model. The above figure shows irrigated crops. The
small figures show the total irrigated area (left) and water extractions (right). (Source: adapted
from [11])
4
Model Comparison
The satisficing model performs significantly better than the utility-based model: it
manages to cover the drop and re-rise in irrigated area and water extracted; and the
areas of irrigated crops are approximated more closely, especially in the phase of fast
changing regulations after 1985. Both models face similar limitations regarding the
empirically observed increase of irrigated traditional cereals after the mid 1990's,
which is not reproducible by any of the models. Furthermore, results of the utility-
based model are more sensitive to data variations. This becomes apparent when
comparing results for melons and garlic. Both of those crops are horticultural crops