Information Technology Reference
In-Depth Information
trust 0
trust 0.2
trust 0.5
trust 0.8
trust 1
trust 0
trust 0.2
trust 0.5
trust 0.8
trust 1
0
50
150
250
0
50
150
250
ticks
ticks
(a) Polarization without bridges
(b) Polarization with bridges
Fig. 4.
Average polarization levels (over 100 runs) without bridges, and with bridges.
AFs distribution is 0
.
5. Different levels of trust are shown.
no matter what the initial distribution is, even when
AF
1
starts from 20% of the
population, it still increase its audience if trust is high.
AF
1
results much more
aggressive toward
AF
2
if bridges are present. A number of other new extensions
arise, even if they are a strict minority.
AF
2
contains more attacks, nevertheless is
not able to win the population nor to defend itself from
AF
1
. More investigation
toward
AF
s properties involved in ABM is needed in order to better understand
this process.
In the third experiment, we check for
AF
resilience. Since
AF
1
appears to be
more aggressive, we label agents with
AF
1
“innovators” and we explore if it is
possible for a relatively small amount of innovators to convince the population
to believe their extension, i.e.
. We can see in Figure 6 that
AF
1
has a
chance of winning over the whole population even if a low number of innovators
{
a, c, e
}
100
100
80
80
20% 2
0%
20%
20% 20% 20%
60
60
40% 40% 40%
40% 40% 40%
40
40
60% 60% 60%
60% 60% 60%
20
20
80% 8
0%
80%
80%
80%
80%
0
0
.2
.5
.8
.2
.5
.8
.2
.5
.8
.2
.5
.8
.2
.5
.8
.2
.5
.8
.2
.5
.8
.2
.5
.8
trust
trust
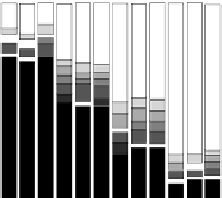
(a) Final diffusion of
AF
s without
bridges.
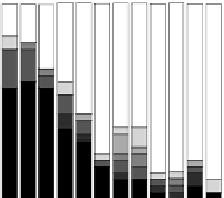
(b) Final diffusion of
AF
sw th
bridges.
Fig. 5.
Diffusion of
AF
s. The percentages on the bars indicate the initial distribution
when only two
AF
s (the black and the white) where present.