Information Technology Reference
In-Depth Information
defect, no gossip
defect, 1 gossip
defect, 10 gossips
0.8
0.6
0.4
groups of
5
10
25
50
0.2
refuse, no gossip
refuse, 1 gossip
refuse, 10 gossips
0.8
0.6
0.4
0.2
0 0 0 0 00 0 0 0 00 0 0 0 0
step
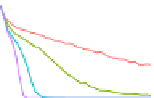
Fig. 3.
Cooperation rates in the first 40 ticks of the simulation experiment. When
Gossipers can refuse the interaction, receiving more information (10 gossips) increases
the cooperation rates in the initial phases of the simulation, especially for groups of 5
and 10 agents.
5, LpLc
5, LpHc
5, HpHc
1.00
0.75
gossip
D−g0
D−g1
D−g10
R−g0
R−g1
R−g10
0.50
0.25
25, LpLc
25, LpHc
25
, H
pHc
1.00
0.75
0.50
0.25
0
25
50
75
100 0
25
50
75
100 0
25
50
75
100
step
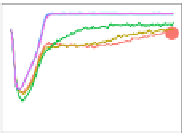
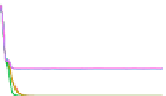
Fig. 4.
Cooperation rates for all populations for different combinations of costs of pun-
ishment and number of gossips for small (5 agents) and large groups (25 agents). Both
small and large groups achieve the highest percentages of cooperation when punish-
ment is costly and being punished is costly as well (HpHc), even if this happens mostly
in the larger group, where cooperation rate is 1 for all the populations except for the
one including agents playing “Defect” and transmitting 10 gossips. This population
has a good performance only when the group is big (25 agents) and the costs of pun-
ishment are low (LpLc). “Refuse” is the best strategy and its e
cacy is increased by
the amount of information exchanged.