Geography Reference
In-Depth Information
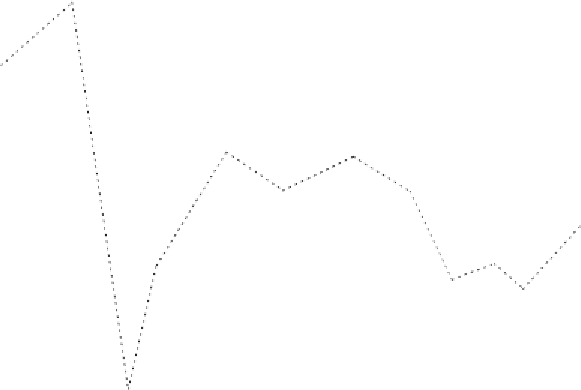
Figure 2.5
Population growth rate of China's western provinces and regions, 1949-2000.
Data from UNESCAP (2004) and China Map Publishers (1984). Data for Tibet
supplemented from Grunfeld (1996). Interpolations for years with data for only
some provinces interpolated by author. Dashed line with solid circles represents
overall mean growth rates for China during the same time periods.
1.08
1.06
1.04
1.02
1.00
0.98
1949
1959
1969
1979
1989
1999
Gansu
Inner Mongolia
Ningxi a
Qingha i
Tibet
Xinjiang
China
memory is also frequently voiced by pastoralists, and is usually given as among the rea-
sons that forage seems less plentiful than in earlier times. Local informants also talk of
natural springs, formerly reliable, that have dried up in recent decades. Data abound on
rivers that no longer flow as they once did, and on retreating glaciers, all contributing to
a sense of gloom and the notion that perhaps western China has just gotten particularly
unlucky of late: an already dry place just happens to be getting even drier.
The veracity of these claims is relevant to the examination of wildlife conservation in
western China. If there really has been a general, long-term drying trend, then carrying
capacity of the land for both livestock and wildlife should have declined. Thus, conflicts
that might exist in any case would have been exacerbated regardless of how people man-
aged themselves, their animals, or the grasslands their animals depend on. Even if such
a general drying trend were part of the global climate change arising from the increasing
accumulation of greenhouse gases in the atmosphere—and thus qualified in some sense as
anthropogenic as opposed to simply being part of some larger atmospheric fluctuation—it
would simply exist as an unfortunate fact that both people and wildlife in China's west
must cope with. The best possible management practices or most eco-friendly attitudes
would be of little use against such a global phenomenon.


Search WWH ::

Custom Search