Geoscience Reference
In-Depth Information
(a)
(b)
Increase in mean
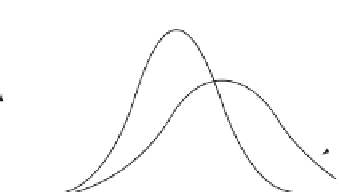
Increase in variance
Previous
climate
More
hot
weather
More
hot
weather
More
cold
weather
Previous
climate
More
record
cold
weather
More
record hot
weather
More
record hot
weather
Less
cold
weather
New
climate
New
climate
Cold
Average
Hot
Cold
Average
Hot
(c)
Increase in mean and variance
Much more
hot
weather
Previous
climate
More
record hot
weather
Less
change for
cold
weather
New
climate
Cold
Average
Hot
Figure 3.4
Schematic diagram showing the effect on extreme temperatures of (a) an
increase in mean temperature, (b) an increase in the variance and (c) an increase in both
mean temperature and variance for a normal distribution of temperature. (Modified from
Climate Change 2001: The Scientific Basis. Contribution of Working Group I to the Third
Assessment Report of the Intergovernmental Panel on Climate Change
(eds J.T. Houghton,
Y. Ding, D.J. Griggs,
et al
.). Cambridge University Press, Cambridge and New York.)
Summer
σ
= 0.94°C
T
'/
σ
= 5.4
10
12
14
16
Temperature (°C)
18
20
22
24
26
Figure 3.5
Distribution of Swiss summer temperatures (June-August) for 1864-2003.
(From
Climate Change 2007: The Physical Science Basis. Contribution of Working Group I
to the Fourth Assessment Report of the Intergovernmental Panel on Climate Change
(eds S. Solomon, D. Qin, M. Manning,
et al
.). Cambridge University Press, Cambridge
and New York after Schär
et al
. 2004.)
In winter, extreme daily precipitation events are very likely to increase in
both magnitude and frequency in the northern parts of Europe, with a larger
relative change in frequency than in magnitude (e.g. Räisänen 2005). In summer,
too, extreme daily precipitation is projected to increase despite decreasing mean


Search WWH ::

Custom Search