Geoscience Reference
In-Depth Information
70
NO
3
concentrations
60
50
40
30
20
10
0
1850
1900
1950
2000
2050
2100
2800
Soil organic C pool
2600
2400
2200
2000
1850
1900
1950
2000
2050
2100
30
Soil C/N ratio
25
MPIA2 SL1
MPIA2 SL2
20
MPIB2 SL1
MPIB2 SL2
HCA2 SL1
HCA2 SL2
HCB2 SL2
HCB2 SL1
15
1850
1900
1950
2000
2050
2100
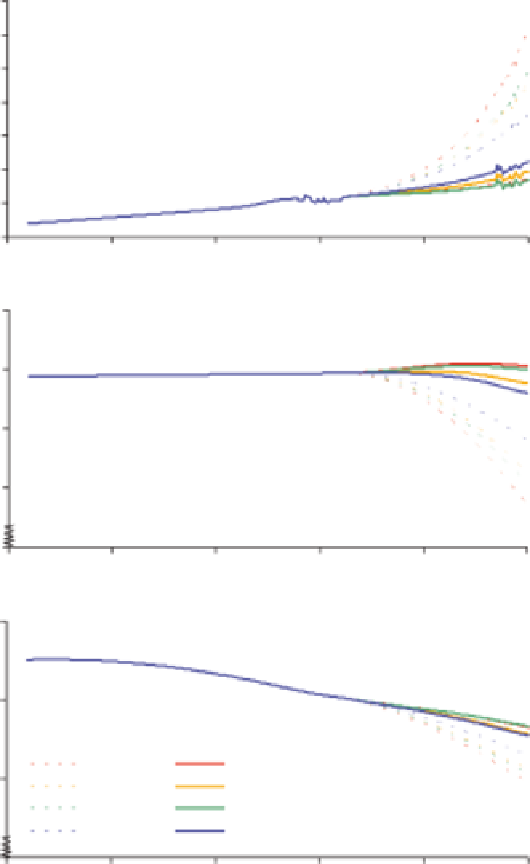
Figure 7.5
Projected NO
3
concentrations in streamwater at Øygard, Norway, under
four climate scenarios and two storylines (SL1 and SL2) of plant processes. The MAGIC
model was used. Also shown are soil C pool and C/N ratio of the soil organic matter.
(From Sjøeng
et al
. 2009b.)
Northern Italy is a hot spot with respect to increasing concentrations of NO
3
in streams and rivers. The trends indicate increasing degree of N saturation in
catchments of small and medium-sized rivers south of the Alps, but climate
variations also appear to play a significant role (Rogora 2007; Rogora &
Mosello 2007). The increase in NO
3
concentrations closely follows the pattern


Search WWH ::

Custom Search