Biology Reference
In-Depth Information
20000
A
I
C
U
15000
T
C
I
C
U
T
T
10000
I
I
C
U
T
C
I
U
T
U
5000
C
I
T
U
C
U
I
T
C
U
T
I
T
U
C
I
C
U
T
I
C
U
T
I
T
C
U
I
T
C
U
I
0
T
C
U
I
0
2
4
6
8
10
12
14
3000
B
2900
U
I
C
T
2800
T
C
U
I
C
U
I
T
2700
C
I
T
U
C
T
I
U
2600
C
C
T, I
U
I
T
U
C
I
C
T
U
C
T
I
C
C
C
C
U
T
I
U
T
I
I
T
U
T
I
T
I
U
U
U
2500
0
2
4
6
8
10
12
14
GENERATION
GENERATION
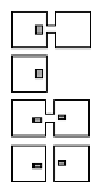
Fig. 17.1
Population growth and founding unique alleles retained in populations of an annual
founded by 172 founders. The trial C population (full input conditions given in the text)
developed with all founders in the fi rst preserve in a preserve-corridor-preserve system (see
legend to right of graph). In other trials, all conditions were exactly the same except as follows:
in trial T, the corridor and the right preserve have been removed; in I, the 172 founders have
been split with 86 founders placed in each preserve; and trial U is exactly like trial I except
that the corridor has been removed.
the other three trials was exactly the same except for the placement of the
square of founders. In trial E, the shortest distance from the left side of
the corridor to a founder was 300 units; for y, the distance was 2,500 units
(placement in the center of the preserve). In trial I, the founders were split
into two rectangles, each with 100 units from the nearest corridor edge to
the nearest founders (placement similar to trial C except with founders split
into two preserves). Only trial I exhibits faster population growth than C,
E, and y. There was no statistical difference for the rate of unique alleles


Search WWH ::

Custom Search