Information Technology Reference
In-Depth Information
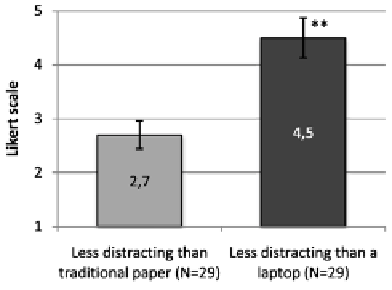
Fig. 5.9
Comparing annotating with CoScribe with traditional pen and paper and a laptop (error
lines indicate the 95 % confidence intervals of the means)
9
9
8
8
7
7
6
6
5
5
4
4
3
2
1
0
020
2140
4160
6180
81100 101120 121140 141160
AnnotationsperLecture
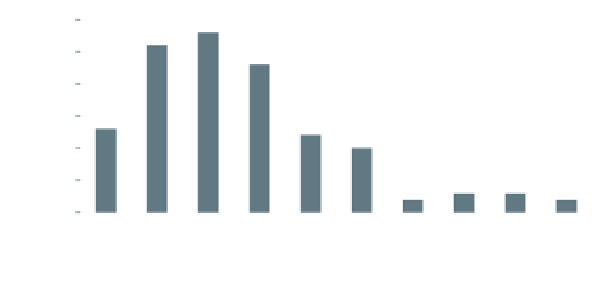
Fig. 5.10
Histogram of the total number of annots. made per participant during a 90 min. lecture
30
30
30
30
30
30
25
25
25
25
25
25
20
20
20
20
20
20
15
15
15
15
15
10
10
10
10
5
5
5
5
0
0
0
0 0.5 0.5 1 1 1.5 1.5 2 2 2.5 2.5 3 3 3.5 3.5 4 4 4.5 >4.5
0 0.5 0.5 1 1 1.5 1.5 2 2 2.5 2.5 3 3 3.5 3.5 4 4 4.5 >4.5
0 0.5 0.5 1 1 1.5 1.5 2 2 2.5 2.5 3 3 3.5 3.5 4 4 4.5 >4.5
Averagenumberofannotationsperparticipant
Averagenumberofannotationsperparticipant
Fig. 5.11
Histogram of the average number of annotations each participant made on a single slide