Database Reference
In-Depth Information
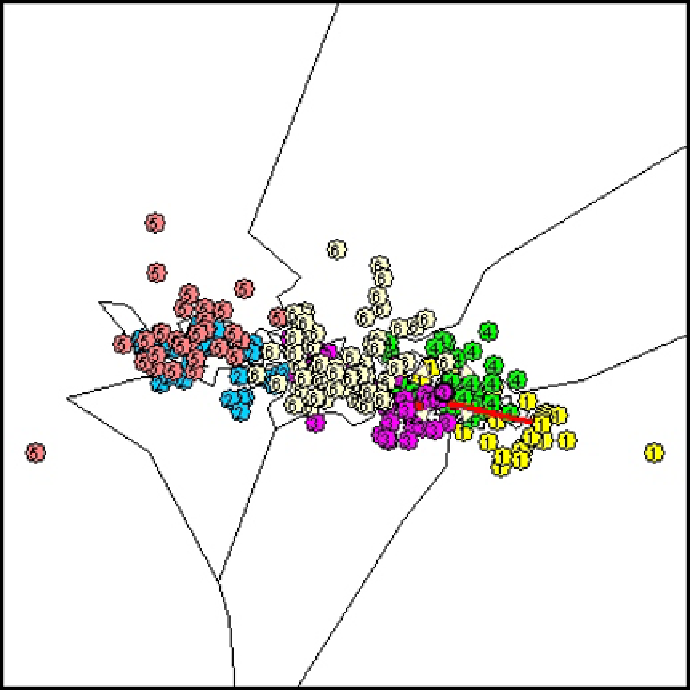
Fig. 2.20.
Visualization of SPLIT6.
more than 200 parameters included in the database. Therefore, the observed
cluster overlap in this unsupervised mapping approach is related to the quasi-
noise of the large number of variables unrelated to the split. However, as in
previous application projects, the feasibility of the dimensionality reduction
and visualization approach could be shown for the regarded semiconductor
manufacturing process.
Additionally, in Fig. 2.21 four selected variables are displayed by compo-
nent plots. It can be perceived from this representation that the variables
C118 and C119 are characteristic for the existing split, whereas C071 distin-
guishes the lots rather than the split, and finally C063, which is characteristic
for neither the lots nor the split.
In addition to the overall visualization of the data, based on unsupervised
dimensionality-reducing mapping and all variables, it is of importance to
determine which parameters or groups of parameters are conforming with or
Search WWH ::

Custom Search