Database Reference
In-Depth Information
Multivariate data visualization
methods
> 3D (IBM),
parallel coordinates
(RHM),
multiple, coupled 2D views
Projection
to 2D/3D
Features
Collective
D
isclosure
of mapping
errors
Individual
Attributes
Grid modes
Interactive
navigation
Component
planes
Generalized
component
planes
Radar
plots
(flakes )
Weight
icons,
glyphs
Class
labels
Text
attrib.
Object
names/no.
Voronoi
tesselation
ALND
Zoom, pan HiPro HiAccess
(wafer
maps)
Fig. 2.17.
Taxonomy of visualization techniques for high-dimensional data.
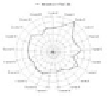
or the area of a rectangle. Alternatively, several variables can be plotted by
iconified radar plots at each projection point (see Fig. 2.10).
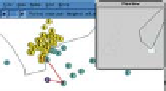
Figure 2.18 (a) shows the underlying multivariate data visualization ar-
chitecture. Especially the features for accessing database contents from the
top-level map should be pointed out here as unique characteristics of the ap-
proach. Two implementations have been conceived so far, the general-purpose
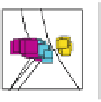
tool WeightWatcher (WW) in QuickCog (Fig. 2.18 (b)) and the dedicated
Acoustic Navigator [2.25] with enhanced interactive features (Fig. 2.18 (c)).
Further interactive enhancements are on the way, e.g., interactive selection,
labeling, and extraction of arbitrary data from the map. The outlined meth-
ods and tools have been compared, assessed [2.24], and employed in numerous
scientific and industrial applications. Examples of applicability are given in
•
rapid prototyping in the design of recognition systems [2.10];
•
analysis of medical databases [2.18];
•
analysis of psychoacoustic sound databases with the extension to synthesis
in sound engineering [2.25]; and
•
analysis and design of integrated circuits with regard to design centering
and yield optimization.
For the case of rapid and transparent recognition system design a brief ex-
ample will be given. A vision system was designed for a medical robot in an
object recognition task [2.10]. Dimensionality reduction and interactive visu-
alization approach helped to assess the current system's capability in terms
of feature space discrimination and occurrence of pop-outs or outliers. This
is illustrated in Fig. 2.19. Additionally, the backtracking capability from the
resulting interactive map is illustrated by invoking the original image of a


Search WWH ::

Custom Search