Database Reference
In-Depth Information
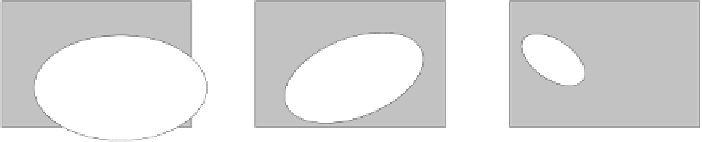
Process specification limit
Process specification limit
Process specification limit
Process
deviation
6 sigma
Process
deviation
6 sigma
Process deviation
6 sigma
Off-centered process
Correlation in process
Multimodality in process
Fig. 2.2.
Illustration of process window problems.
ical statistical analysis approach employed for the analysis and evaluation of
process-related data. Individual parameters are checked for model consistency
with regard to univariate, typically Gaussian assumptions. Further, methods
like principal component analysis are used, which by its nature is a linear
and parametric approach and, thus, is of limited applicability for nonlinear
cases not obeying a multivariate Gaussian model. The significant economic
potential of the data mining field in general and the field of semiconductor
process data analysis in particular has triggered many activities. Numerous
statistical tools with interactive visualization have recently become available.
For instance, for the semiconductor industry, tools like dataPOWERsc [2.51],
Knights' Yield Manager [2.52], or Q-Yield [2.7] are on the market. These tools
dominantly apply parametric first order methods, i.e., methods based on the
statistical information of a single variable or the correlation of two selected
variables.
Thus, for the cases regarded earlier, advanced methods from soft comput-
ing originating from the fields of pattern recognition, neural networks, bio-
inspired computing and statistics, and corresponding tool implementations
provide improved leverage by multivariate, nonparametric, and nonlinear ap-
proaches. In Section 2.3.1, specific methods and their potential for advanced
process window modeling and detection of deviation from the process window
in (semi)automatic operation are briefly presented.
For the o
ine analysis of the multivariate process data as a baseline
for ensuing process control and optimization, advanced methods for e
cient
multivariate data dimensionality reduction and interactive visualization can
be salient. The benefit is given in terms of capturing multidimensional re-
lations in the data, transparency as well as speed in the process of analy-
sis, and knowledge extraction. In prior work of other groups, e.g., Goser's
group in Dortmund [2.38] [2.14], Kohonen's self-organizing map (SOM) has
been applied. In an enhancement of this work Ruckert et al. [2.47] have de-
veloped the dedicated tool DANI for the analysis of semiconductor data of
Robert Bosch GmbH. In this kind of application, the topology-preserving
and dimensionality-reduction mapping properties of the SOM are exploited
in conjunction with visualization enhancements, as, e.g., the U-Matrix of
Ultsch [2.54]. The properties of the SOM and other neural networks have

Search WWH ::

Custom Search