Database Reference
In-Depth Information
(a) 2466 customers, $126,899 revenue
(b) [1 − 1645], [$52 − $78, 480]
(c) [4
−
978], [$1261
−
$12, 162]
(d) [48
−
597], [$608
−
$70, 443]
(e) [122 − 125], [$1624 − $14, 361]
(f) [28 − 203], [$6187 − $6609]
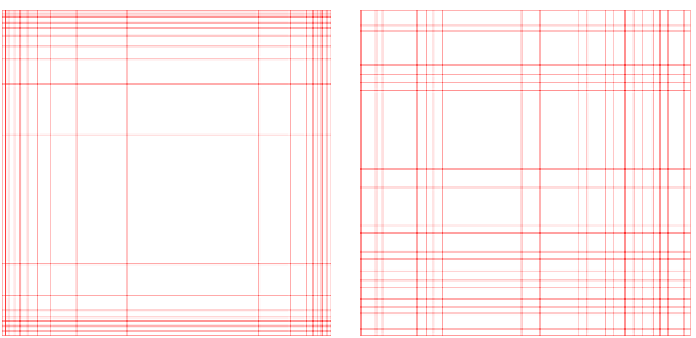
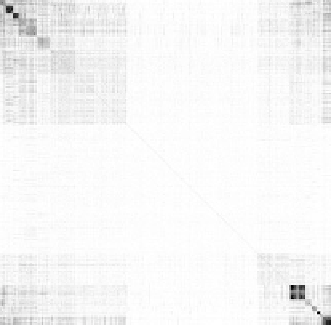
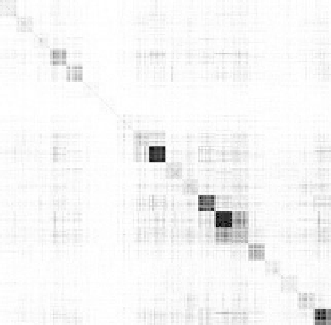
Fig. 3.4.
Visualizing partitioning drugstore customers into 20 clusters. Relationship
visualizations using
Clusion
: (a) original (randomly) ordered similarity matrix,(b)
seriated or partially reordered using Euclidean k-means, (c) using SOM, (d) using
standard Jaccard k-means, (e) using extended Jaccard sample balanced
Opossum
,
and (f) using value balanced
Opossum
clustering. Customer and revenue ranges are
given beneath each image. In (a), (b), (c), and (d) clusters are neither compact nor
balanced. In (e) and (f) clusters are much more compact, even though there is the
additional constraint that they be balanced, based on equal number of customers
and equal revenue metrics, respectively.


Search WWH ::

Custom Search