Environmental Engineering Reference
In-Depth Information
3High
Ra
and Ultimate Regime
Studying flows at
Ra
comparable to those of natural phenomena is challenging:
numerical simulations and experiments cannot yet reach the parameter limits, and
extrapolating the behavior from the dynamics at lower
Ra
is not always an option, in
particular because different theories suggest different scenarios. Hence, answering
even the apparently simple question of how much thermal energy is carried by the flow
for a stipulated temperature difference is very hard when the temperature difference is
large. This question can be formalized by looking for the dependence of the Nusselt
number, the dimensionless heat transfer coefficient, on the Rayleigh number. The
Nusselt number is defined as
Nu
k
, where
h
is the measured heat transfer
coefficient and
k
is the thermal conductivity of the fluid.
Several scaling theories have been proposed over the years. The oldest is the
marginal stability theory by Malkus (
1954
), in which
Nu
=
hH
/
Ra
1
/
3
. Written out
in detail, this means that the heat transport is independent of the container height.
The experiment with cryogenic helium in Chicago from the late 80s (Castaing et al.
1989
) led to theories where the scaling exponent was 2/7. Additional and more
precise experiments and simulations have made it clear that none of these theories
could explain all the observations (though there have been suggestions in favor of the
1/3 power, see Urban et al. (
2014
)). A phenomenological theory that tries to account
for the observed results is that of Grossmann and Lohse (
2000
). In this theory, there
are two coupled equations for the Nusselt number and the flow Reynolds number,
with six free parameters fitted to experimental and numerical data (for the updated
prefactors based on the latest experiments and simulations, see Stevens et al. (
2013
)).
The theory divides the
Pr
∼
Ra
parameters space into several regions in which either
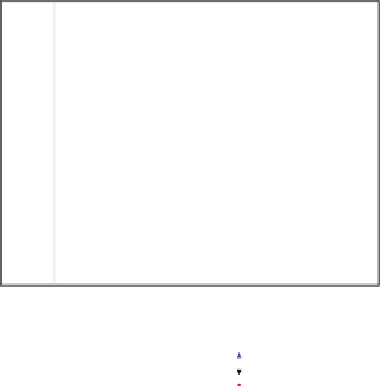
the bulk or the boundary layer dominates the dissipation rates (see Fig.
4
).
−
Fig. 4
Rayleigh-Bénard
convection phase diagram in
the
Ra
10
6
III
∞
III
u
I
∞
−
Pr
space for
ʓ
=
2 where the different
regimes are from the
Grossmann-Lohse theory.
There is a dearth of data
from experiments and
simulation for the so-called
ultimate regime (
IV
l
), in
which the kinetic boundary
layer is assumed to be
“completely” turbulent. The
figure is adapted from
Stevens et al. (
2013
)
1
/
10
4
IV
u
10
2
I
u
II
u
Pr
10
0
,
IV
l
10
−2
II
l
IV
l
,
IV
l
10
−4
,
II
l
10
4
10
6
10
8
10
10
10
12
10
14
10
16
10
18
Ra
Castaing et al. 1989
Chavanne et al. 1997
Glazier et al. 1999
Niemela et al. 2000
Ahlers and Xu 2001
Chaumat et al. 2002
Burnishev et al. 2010
Ahlers et al. 2009b
Roche et al. 2010
Stevens et al. 2010−2011
He et al. 2012b


Search WWH ::

Custom Search