Environmental Engineering Reference
In-Depth Information
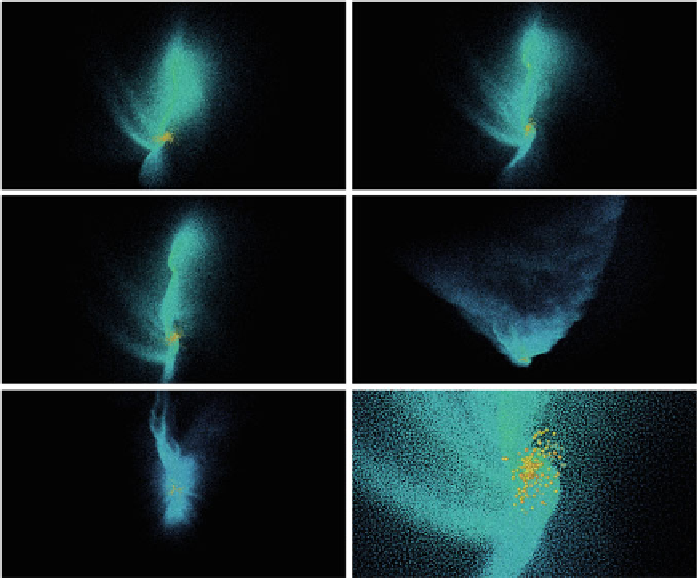
Fig. 6
Freely rotated view of the collided system to show the formed accretion centers observed
as
yellow dots
for models:
P
1(
top left panel
),
P
2(
top right panel
),
P
3(
middle left panel
),
P
4
(
middle right panel
),
P
5(
bottom left panel
), and a zoom of
P
2(
bottom right panel
, this is a zoom
of the
top right panel
)
2, the effects on the
target core are more severe. For example, in Fig.
5
we can see that even for the low and
intermediate pre-collision velocity models, the target core is almost divided entirely
into two parts and it fully breaks for the high velocity model, see the bottom panels
of Fig.
5
.
In fact, for model
P
6, self-gravity and gas viscosity do manage to slow down
the penetration of the bullet, and the two separated core parts coalescence, such that
the system becomes a long and expanding filament, as can be seen in the last panel
of Fig.
5
.
In Fig.
6
we show a freely rotated 3
D
view of some models, with the purpose
of better appreciating the formed accretion centers. It should be noticed that most
accretion centers grow from the gas agglomeration formed around the bullet, as the
densest gas particles are located at the interaction region. As an example, for model
P2we zoom in the top right panel of Fig.
6
to get the bottom right panel of Fig.
6
where
we observe the spatial distribution of the accretion centers. There are no accretion
When the radius of the bullet increases from
R
0
/
4to
R
0
/
Search WWH ::

Custom Search