Environmental Engineering Reference
In-Depth Information
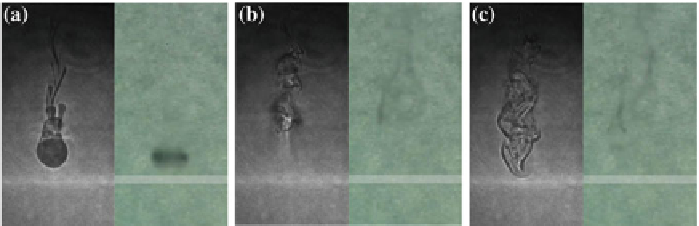
Fig. 3
Settling: Images on the
left
are shadowgraphs, images on the
right
are direct visualizations.
There is an interval of 2.37 s between (
a
)and(
b
), and 3.6 s between (
b
)and(
c
)
3 Results
In most cases the image obtained through a shadowgraph is more clear than the direct
image.
3.1 Settling
The densities of the drop and of the top fluid are the same. The vortex is formed as
the drop enters the fluid (Fig.
3
a), it touches the interface and goes up again (Fig.
3
b).
Then it starts to oscillate but settles on the top layer and eventually loses its form
(Fig.
3
c). The interface appears as a clear shadow
3.2 Chandelier
When the thickness of the top layer is increased, the vortex ring seems to crash as it
enters the fluid; the core of the vortex is trapped but a slow fingering process starts
on the outside (Fig.
4
). After a very long time, some fingers arrive at the interface
due to gravity but most of the material remains on the top layer.
In this case both types of images show the process quite clearly.
3.3 Core Fallout
In this case the drop has a bigger radius, hence more mass and is heavier. The core
goes down faster than the outside material, as opposed to the previous case. The
vortex ring touches the interface (Fig.
5
a), rises in the form of a jellyfish (Fig.
5
b)
Search WWH ::

Custom Search