Environmental Engineering Reference
In-Depth Information
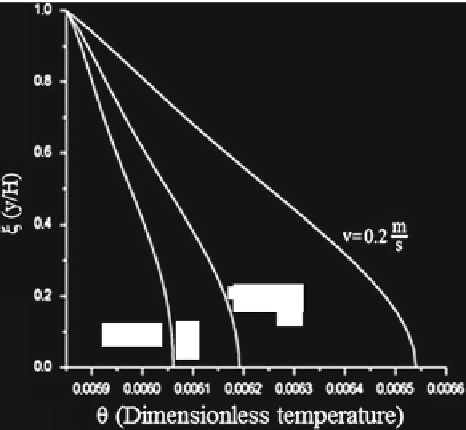
Fig. 5
Temperature profile
at different screw speeds
with:
P
=
3,000 psi,
n
=
1
/
3
Φ
=1
Φ
=0.5
Φ
=0.25
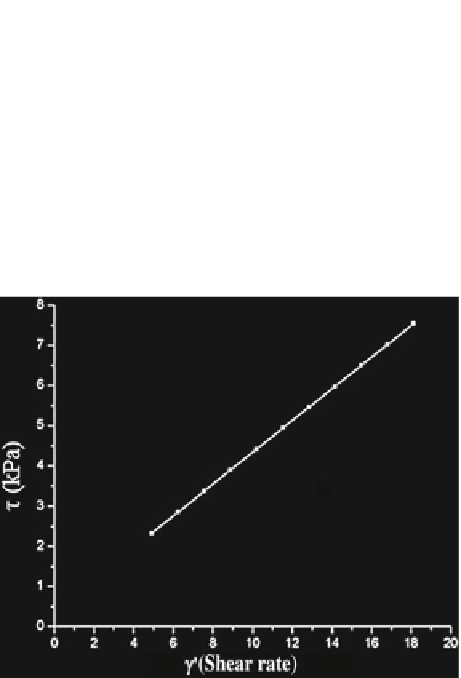
Fig. 6
Stress depending on
the deformation rate for a
Newtonian fluid
Figure
6
presents the flow curve for a Newtonian fluid which shows that the rela-
tionship between the stress tensor and the shear rate is linear. In this case the viscosity
is independent of the shear rate according to Tadmor and Gogos (
2006
). For a non-
Newtonian fluid the shear stress varies non-linearly with the shear rate as shown in
Fig.
7
. The behavior in Fig.
7
describes a pseudoplastic or shear thinning fluid, which
is correct for the biopolymer considered in this work.
Search WWH ::

Custom Search