Environmental Engineering Reference
In-Depth Information
Fig. 3
Identification of
coefficient (a)
22
y = 0.0337x + 8.2171x 10 ^6
R² = 0.9836
21
20
19
18
17
16
15
200
250
300
350
400
Reynolds Number, ( x 10 ^ 6)
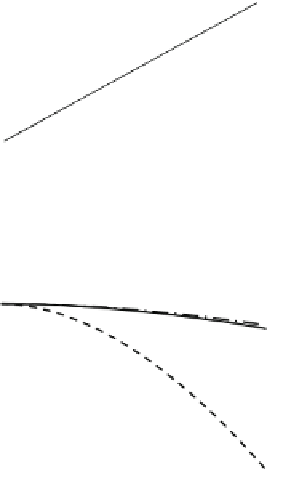
Fig. 4
Evaluation of
coefficient (a) for the case
A2 indicated in Table
2
x axis, [m]
0
2
4
6
8
0
-5
-10
-15
Eq. 1
CFD
Eq. 2
-20
-25
was compared with Eq.
1
and the numerical solution, presenting the results in Fig.
4
.
The comparison shows that Eq.
2
significantly enhances the prediction and proves
that an additional coefficient reduces the effort demanded in an evaluation of several
scenarios through numerical solutions for a spillway with the same characteristics in
the design.
Investigations related to the implementation of Eq.
2
for a set of numerical solu-
tions with spillways of different characteristics in the design requires further analysis.
For instance differences in a set of spillways with a marked difference in the slope
of the wall at the upstream or downstream side of the spillway may affect the water
flow behavior significantly.
4 Conclusions
This work presents a proposal to evaluate the predicted water fall profile for a spill-
way with no slope at any of the two faces. The modification in a simplified analytical
equation consists only in the addition of the (Re) and an associated coefficient (a)
as parameters that can include all the phenomena happening in a spillway water
fall under turbulent conditions. The coefficient (a) will be reliable within a regime
of operation of the spillway previously evaluated through numerical solutions. The
inclusion of the coefficient (a) does not increase the difficulty in quick calcula-


Search WWH ::

Custom Search