Environmental Engineering Reference
In-Depth Information
experimentally by Honji and Haraguchi (
1995
) for the flow past a single magnetic
obstacle. Further, it almost coincides with the value of 0.150 corresponding to the
flow past a solid cylinder (Zdravkovich
1997
). For the bistable flow at
D
5
(Fig.
5
b), it does not exist a clear dominant frequency since this local analysis does
not capture the global behavior of the biased flow that may present two distinct char-
acteristic frequencies for the vortex shedding. Finally, Fig.
5
c,d display very similar
Strouhal numbers of 0.235 and 0.237 for
D
=
1
.
3, respectively. It could be
expected that for a large enough separation distance, the dominant frequency of each
wake should be close to that of a single magnetic obstacle (
=
2 and
D
=
≈
0.152). The difference
with the latter case for
D
3 manifests that the coupling of the wakes
is still present at these separation distances. In fact, for the flow past a pair of solid
cylinders side by side, the uncoupling of the wakes is observed at
D
=
2 and
D
=
≈
5
.
5(LeGal
et al.
1990
).
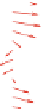
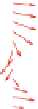
A characteristic feature of the bistable regime is the tendency of the flow in the
gap between the obstacles to tilt towards one obstacle at a given time and towards the
other obstacle at a later time. This deflection breaks the symmetry of the flow pattern
(Le Gal et al.
1990
). Figure
6
illustrates this phenomenon through the instantaneous
velocity fields at two different times for the bistable regime observed when
D
5.
Although in previous results only time-dependent flows were considered, at lower
values of
Q
steady flow patterns displaying a vortex pair are found (Román
2013
).
With the aim of describing the studied flow in a more complete way, Fig.
7
presents
a map that shows the regions of steady and time-dependent behavior in terms of the
analyzed values of
Q
and
D
,for
Re
=
1
.
=
1,000. The transition zone between steady
and unsteady flows is presented with a gray strip since it is not possible to determine
an exact value for this transition. This map is built based on the time behavior of the
velocity signals. It is observed that for a fixed
D
, vortex shedding disappears as
Q
decreases.
(a)
(b)
6
6
5
5
4
4
3
3
2
2
1
1
10
12
14
16
18
20
10
12
14
16
18
20
x
x
Fig. 6
Instantaneous velocity fields for the bistable regime.
Re
=
1,000,
Q
=
2
.
9and
D
=
1
.
5.
a
t
=
1975,
b
t
=
1992


Search WWH ::

Custom Search