Environmental Engineering Reference
In-Depth Information
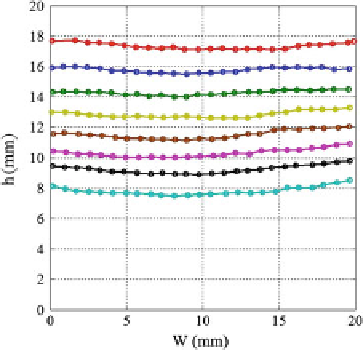
Fig. 5
Profiles of the solidification front as a function of time. Starting at the uppermost profile
downwards, the position of the solidification fronts are captured at t
=
6.1, 7.6, 9.2, 10.7, 12.3, 13.8,
15.4, 17.7 min
Fig. 6
Normalized position of the solidification front h
∗
and Rayleigh number based on the height
of the liquid region as functions of time. In the inset, the log-log plot of the solidification front
position as a function of time is given to establish the h
∗
t
1
/
2
15.7 min. The
vertical lines
in the inset indicate the times corresponding to 3 and 15.7 min respectively
∼
relation for t
>
The time evolution of the position of the (normalized) solidification front h
∗
=
1
−
h/h(t
=
0) and the Rayleigh number
Ra
are shown in Fig.
6
. The front starts
moving at
t
7 min (indicated in the graph with a vertical line) and reaches its
maximum value at
t
=
2
.
40 min. The Rayleigh number is a monotonously decreasing
function of time, but before the formation of the solidification front, the slope is
=


Search WWH ::

Custom Search